
TradingViewMACD
指标
3 购买
版本 1.0, Feb 2025
Windows 版、Mac 版
5.0
评价:1

说明
TradingViewMACD 指标
通过我们高度可定制的 TradingViewMACD 指标提升您的交易策略,该指标专为 cAlgo 平台设计。这个强大的工具结合了优化市场分析所需的灵活性和精确性。
主要特性:
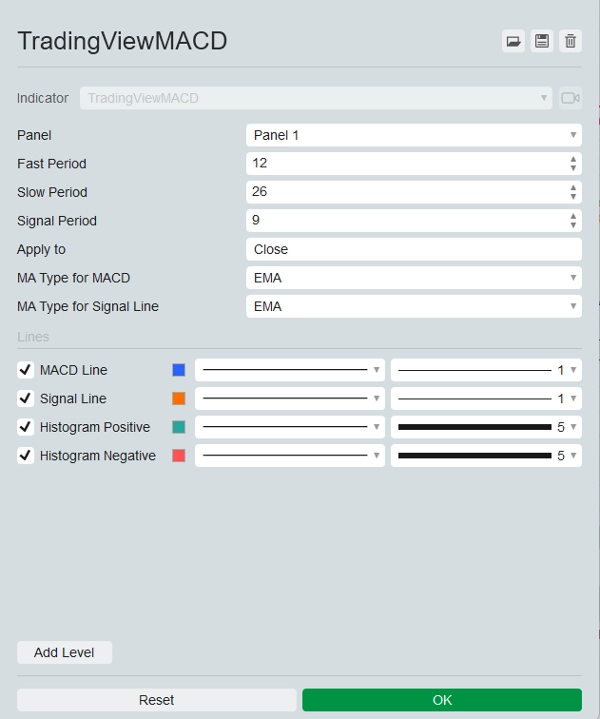
- 可定制参数:
-
- 快速周期:调整快速移动平均周期以适应您的交易风格。
- 慢速周期:配置慢速移动平均周期以提高信号的准确性。
- 信号周期:设置信号线周期以微调您的进出点。
- 应用价格:从开盘价、高价、低价、收盘价、中价、典型价或加权价中选择应用指标的价格。
- 多种移动平均类型:
-
- 在简单移动平均(SMA)和指数移动平均(EMA)之间为 MACD 线和信号线选择,提供分析的灵活性。
- 视觉输出:
-
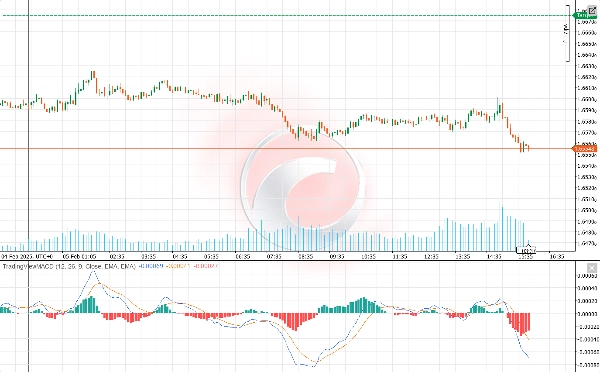
- MACD 线:以醒目的蓝色显示,清晰可见。
- 信号线:以鲜艳的橙色突出显示,便于区分 MACD 线。
- 柱状图:用绿色和红色分别区分正值和负值,清晰展示市场动能的视觉表现。
- 增强的市场洞察:
-
- 该指标计算快速和慢速移动平均之间的差异以生成 MACD 线。
- 将信号线计算为 MACD 线的移动平均。
- 柱状图直观地表示 MACD 线与信号线之间的差异,帮助您识别潜在的买卖信号。
- 用户友好:
-
- 易于安装和配置,使各级交易者都能受益于其高级功能。
- 提供全面的文档和客户支持,确保顺畅的使用体验。
释放 TradingViewMACD 指标的全部潜力,提升您的交易策略。增强市场分析,做出明智决策,领先一步,掌握这款必备的交易工具。
摘要
AI 摘要
The TradingViewMACD indicator for the cAlgo platform is a customizable technical analysis tool designed to enhance market analysis. It calculates the difference between fast and slow moving averages to generate the MACD line, computes a signal line as the moving average of the MACD line, and displays a histogram representing the difference between these lines to help identify potential buy and sell signals.
Key features include adjustable parameters such as fast period, slow period, signal period, and applied price (open, high, low, close, median, typical, or weighted). Users can select between Simple Moving Average (SMA) and Exponential Moving Average (EMA) types for both the MACD and signal lines, providing analytical flexibility.
Visual outputs consist of a blue MACD line, an orange signal line, and a histogram with green and red colors indicating positive and negative momentum, respectively. The indicator is designed for ease of installation and configuration, supported by comprehensive documentation and customer support to accommodate traders of all experience levels.
指标配置
客户评价
5.0
评价:1
5 | 100 % | |
4 | 0 % | |
3 | 0 % | |
2 | 0 % | |
1 | 0 % |
客户评价
November 9, 2025
TradingView MACD brings the familiar feel straight to cTrader 🚀 - smooth, light, and 100% accurate to the original. Perfect for traders switching from TV who love clean momentum signals. Missing alerts, but flawless for classic trend and divergence play.
讨论
常见问答
Signal
MACD
cTrader Store 提供的所有产品,包括交易机器人、指标和插件,均由第三方开发者提供,仅供信息参考和技术访问之用。cTrader Store 并非经纪商,不提供投资建议、个人推荐或任何未来业绩保证。


价格
注册日期 22/11/2024
133
销售
2.57K
免费安装