
说明
ZigzagSR – 带自动支撑与阻力的动态之字形波动
通过 ZigzagSR 这一强大的 cTrader 指标,解锁更清晰的市场结构和精准的入场区域:
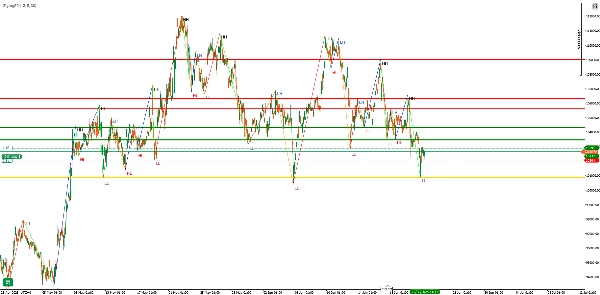
- 实时绘制非重绘的之字形波动(更高的高点、更低的高点、更高的低点、更低的低点)
- 基于最新的枢轴波动自动绘制动态支撑与阻力水平
- 为每个波动点标注(“HH”、“LH”、“HL”、“LL”),一目了然的趋势清晰度
主要特点
- 自适应之字形检测
-
- 可配置的 深度、偏差 和 回溯步数 参数,用于微调对市场噪音的敏感度
- 非重绘逻辑确保历史信号一旦绘制即保持稳定
- 自动支撑阻力水平
-
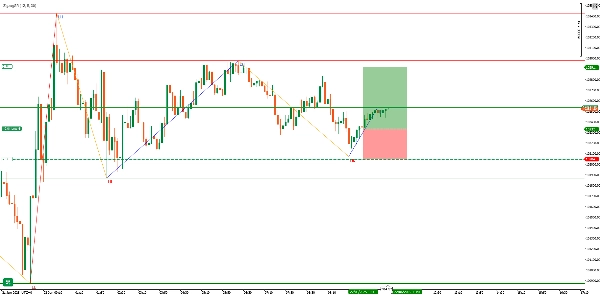
- 在最后一个有效波动点绘制 枢轴 线(金色线)
- 突出显示枢轴前最多三个 阻力 高点(红线)和三个 支撑 低点(绿线)
- 随着新波动形成,线条无缝更新,保持图表整洁
- 清晰的视觉标签
-
- “HH”(更高的高点)和“LH”(更低的高点)表示看跌/较高峰值
- “HL”(更高的低点)和“LL”(更低的低点)表示看涨/较低谷值
- 颜色编码的之字形段:
-
- HH → 青柠绿
- LH → 橙色
- HL → 蓝色
- LL → 红色
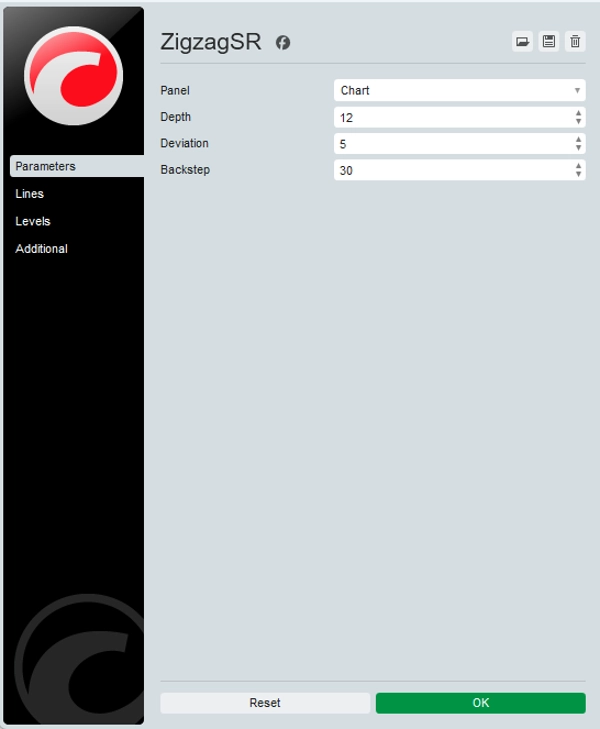
输入参数与自定义
参数默认值说明
深度
12
回溯的柱数,用于识别局部高点/低点
偏差
5
计为波动的最小价格变动(以点数计)
回溯步数
3
用于“回退”以抑制虚假枢轴的柱数
提示: 在更高时间框架上增加 深度 和 偏差 以过滤噪音;在 M1/M5 上降低它们以提高敏感度。
为什么使用 ZigzagSR?
- 趋势确认:清晰区分冲击波与调整波——非常适合波段和突破交易者。
- 支撑阻力入场区域:自动标记的水平帮助你精准定位入场、止损和获利区域,无需手动绘线。
- 策略开发:标签和线条可直接用于 EAs/cBots 或手动系统——构建一致的规则化策略。
工作原理
- 高低点映射
-
- 扫描过去
Depth个周期的柱子,标记局部极值(_highMap和_lowMap)。
- 扫描过去
- 波动构建
-
- 在看涨和看跌状态间交替,仅将重要枢轴添加到波动列表中。
- 标签分配
-
- 将每个枢轴与前一个比较,标记为 HH/LH 或 HL/LL。
- 支撑阻力绘制
-
- 识别最新枢轴为“枢轴线”,然后绘制前三个有效高点和低点作为阻力/支撑。
- 之字形渲染
-
- 用彩色趋势线连接所有波动点,并稍微偏移叠加文本标签以提高清晰度。
使用场景与提示
- 波段交易:利用多柱冲击波——在回调至枢轴线时入场,目标为下一个支撑阻力水平。
- 突破确认:等待价格突破 ZigzagSR 绘制的阻力线,然后结合成交量或 RSI 进行确认。
- 与其他指标叠加:结合移动平均线、RSI 背离或成交量剖面以增强信号。
几秒钟内开始使用:
- 从 cTrader 商店安装 ZigzagSR。
- 将其拖放到任意图表上——无需外部库。
- 根据你的时间框架和策略风格调整三个输入参数。
通过实时波动结构和动态支撑阻力提升你的图表分析——立即试用 ZigzagSR!
摘要
AI 摘要
ZigzagSR is a cTrader indicator that dynamically identifies market swings and automatically plots support and resistance (SR) levels. It detects non-repainting zigzag swings in real time, labeling each pivot as Higher High (HH), Lower High (LH), Higher Low (HL), or Lower Low (LL) to clarify trend direction. The indicator draws a pivot line at the latest valid swing point and highlights up to three preceding resistance highs and support lows, updating these levels seamlessly as new swings form.
Key customizable parameters include Depth (look-back bars for local highs/lows), Deviation (minimum price move in ticks to qualify as a swing), and Backstep (bars to rewind to suppress false pivots). This adaptive detection allows users to fine-tune sensitivity to market noise across different timeframes.
ZigzagSR supports trend confirmation by distinguishing impulsive versus corrective swings, aids in identifying precise entry, stop-loss, and take-profit zones, and facilitates strategy development by providing clear labels and lines usable in automated or manual trading systems. Typical use cases include swing trading, breakout confirmation, and combining with other indicators such as RSI or moving averages for enhanced signal validation.
Installation requires adding ZigzagSR to any cTrader chart with no external dependencies, followed by parameter adjustment to fit individual trading styles and timeframes.
指标配置
客户评价
4.3
评价:3
5 | 33 % | |
4 | 67 % | |
3 | 0 % | |
2 | 0 % | |
1 | 0 % |
客户评价
November 9, 2025
ZigzagSR combines classic wave mapping with auto S/R zones. Clean, responsive, and great for spotting turning points. A must-have for structure-focused traders. Could use alerts for new high/low formations, but performance and clarity are top-notch.
July 6, 2025
the review gets easier when it adds a check without pretending to know everything, and It needs a boring test before bigger size.
讨论
常见问答
Breakout
Commodities
RSI
XAUUSD
cTrader Store 提供的所有产品,包括交易机器人、指标和插件,均由第三方开发者提供,仅供信息参考和技术访问之用。cTrader Store 并非经纪商,不提供投资建议、个人推荐或任何未来业绩保证。


价格
注册日期 22/11/2024
140
销售
2.61K
免费安装