
说明
⚡ 主要特点
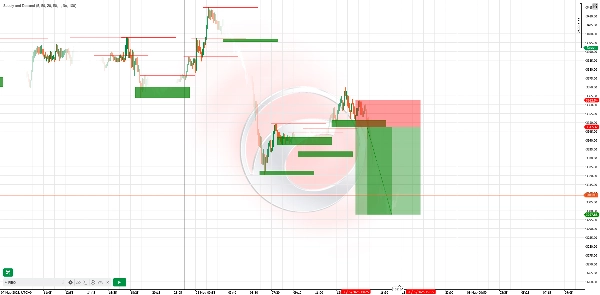
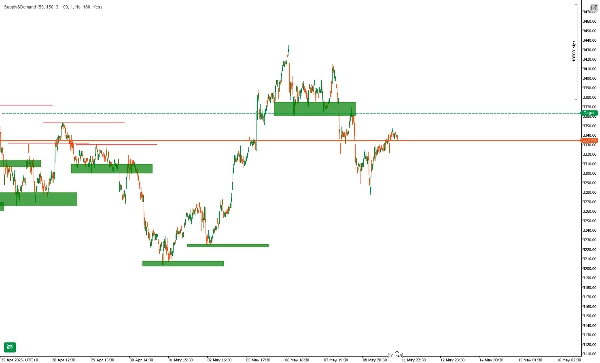
- 动态区域检测
-
- 自动检测摆动高点/低点,并实时绘制供给(阻力)和需求(支撑)区域。
- 可配置的回溯和区域宽度参数,让您适应任何市场或时间框架的灵敏度。
- 原始区域高亮
-
- 新鲜的“原始”区域(价格未触及过)会被视觉强调——在机构留下订单的地方交易。
- 可选择隐藏已触及的区域,保持图表整洁。
- 多时间框架过滤
-
- 仅绘制与您的图表时间框架倍数对齐的区域(例如,在1小时图上显示日线区域)。
- 快速查看高时间框架供给/需求与您的日内设置的汇合。
- 非重绘且无滞后
-
- 区域一旦绘制即固定——价格移动后不会消失或移动线条。
- 经过回测的可靠性:区域保持静态,让您对历史分析充满信心。
- 自定义提醒与日志记录
-
- 当价格进入或突破区域时,接收弹出或邮件提醒。
- 详细的调试日志显示区域创建、跳过的重叠和区域触及情况。
🚀 工作原理
- 枢轴检测:指标根据您选择的回溯,扫描每个新柱的枢轴高点(供给)和枢轴低点(需求)。
- 区域构建:为每个枢轴绘制一个向前延伸的矩形区域——突出显示机构可能下达限价单的位置。
- 重叠过滤:超过阈值的重叠区域合并或跳过,确保只保留最重要的区域。
- 仅原始选项:仅保持未触及的区域可见,专注于最新的机构水平。
🎯 示例交易策略
策略 时间框架 进场 止损 止盈
区域拒绝
H1
等待价格反弹进入需求区,并在供给区显示看跌蜡烛(吞没/针形线)
刚好超出区域边界
1.5倍区域高度
时间框架汇合
M15 + H4
识别H4需求区,然后切换到M15寻找该区域内的看涨动量蜡烛
低于H4区域低点
下一个H4摆动高点
突破与回测
H4
价格突破供给区后,等待区域下方的回测和看跌确认
高于区域顶部
最近的H4低点
使用提示: 结合RSI或MACD背离在区域内使用,以获得更高概率的信号。
📈 真实案例
- 在EURUSD H4图上,指标绘制了1.0950–1.0980的需求区。
- 价格下探该区域,形成了M15的看涨吞没蜡烛。
- 进场价1.0970,止损1.0945(低于区域),目标价1.1040(下一个H4阻力)。
- 结果:+70点(约6.4倍风险)。
⚠️ 免责声明
此指标是一个工具——不是保证盈利的系统。过去的表现不保证未来结果。始终使用适当的风险管理(例如每笔交易最多2%),先在模拟账户测试,并结合您自己的分析。交易存在亏损风险;仅使用您能承受损失的资金进行交易。
摘要
AI 摘要
Supply&Demand is a trading indicator that automatically identifies and plots key supply (resistance) and demand (support) zones on price charts in real time. It detects swing highs and lows using configurable lookback and zone-width settings, adapting to any market or timeframe. The indicator highlights “virgin” zones—areas untouched by price—emphasizing potential institutional order levels, with an option to hide touched zones for chart clarity.
It supports multi-timeframe filtering, allowing users to display zones aligned with higher timeframe multiples on lower timeframe charts, facilitating confluence analysis. Zones are non-repainting and non-lagging; once drawn, they remain fixed, ensuring reliable historical analysis. Custom alerts notify users when price enters or breaks these zones, and detailed logs track zone creation and interactions.
The indicator operates by scanning each new bar for pivot highs and lows, constructing rectangular zones extending forward, and filtering overlapping zones to retain the most significant areas. It offers a “virgin-only” mode to focus on fresh institutional levels.
Example strategies include zone rejection, multi-timeframe confluence, and break & retest setups, often combined with RSI or MACD divergence for higher-probability signals. A real-world example on EURUSD H4 demonstrates entry, stop-loss, and take-profit placement based on demand zones and candlestick confirmation.
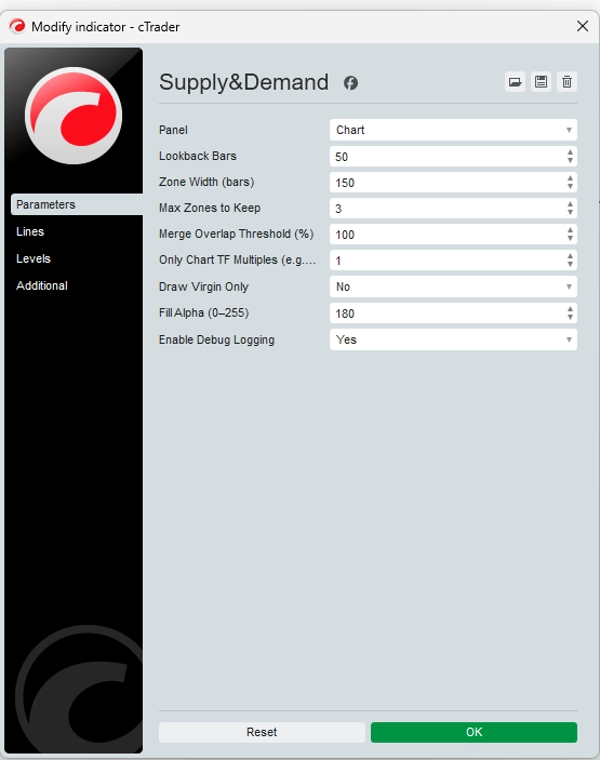
指标配置
客户评价
4.7
评价:4
5 | 75 % | |
4 | 25 % | |
3 | 0 % | |
2 | 0 % | |
1 | 0 % |
客户评价
November 9, 2025
A solid Supply & Demand tool - clear zones, stable performance, and visually neat. Great for spotting imbalances and retracement entries. Would love built-in alerts, but overall it’s a reliable companion for swing and intraday setups.
May 23, 2025
The main upside is low quality setups lose some appeal. It can look better than it is during a lucky run.
May 18, 2025
The first 10 trades should stay boring, and unclear signals stop looking so clean.
May 15, 2025
讨论
常见问答
EURUSD
RSI
MACD
cTrader Store 提供的所有产品,包括交易机器人、指标和插件,均由第三方开发者提供,仅供信息参考和技术访问之用。cTrader Store 并非经纪商,不提供投资建议、个人推荐或任何未来业绩保证。


价格
注册日期 22/11/2024
138
销售
2.61K
免费安装