
Описание
Руководство пользователя WinSMC
1. Назначение
`WinSMC` — это наложенный индикатор SMC для cTrader. Он помогает визуально определить:
- Сдвиги рыночной структуры
- `BOS` (Прорыв структуры)
- `MSS` (Сдвиг рыночной структуры)
- `Order Blocks` (Блоки ордеров)
- `Liquidity Grabs` / `Sweeps` (Захваты ликвидности / Выметания)
- `FVG` (Разрывы справедливой стоимости)
Это не система автоматической торговли. Это инструмент структуры и контекста, лучше всего используемый для торговли на основе подтверждений.
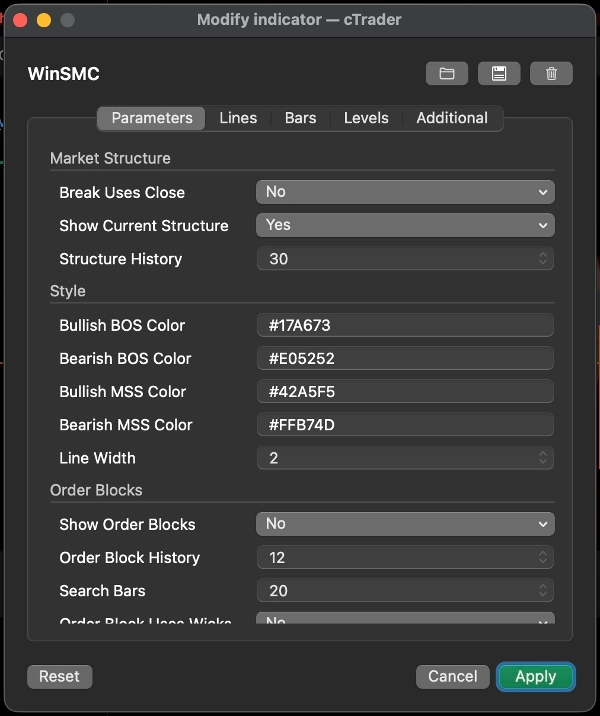
2. Основные понятия
Длина колебания
`Swing Length` контролирует, насколько далеко влево и вправо должен быть подтвержден поворот, прежде чем он будет считаться действительной точкой колебания.
Практические рекомендации:
- Меньшие значения = больше сигналов, больше шума
- Большие значения = меньше сигналов, чище структура
Подтверждение прорыва закрытием
Этот параметр определяет, подтверждается ли прорыв структуры:
- `Да`: закрытием свечи
- `Нет`: прорывом тени/минимума/максимума
Рекомендации:
- Используйте закрытие для более консервативного подхода
- Используйте прорывы теней для более раннего, более чувствительного обнаружения
Показать текущую структуру
Отображает текущие активные линии swing high и swing low, помогая видеть, что рынок всё ещё учитывает.
История структуры
Контролирует, сколько линий и меток прорыва структуры сохраняется на графике.
3. BOS и MSS
BOS
`BOS` означает, что цена продолжает движение в том же направлении и пробивает предыдущий максимум или минимум.
Типичное толкование:
- При восходящем тренде пробой предыдущего максимума — это бычий BOS
- При нисходящем тренде пробой предыдущего минимума — это медвежий BOS
MSS
`MSS` означает, что рынок изменил направление относительно предыдущего уклона.
Типичное толкование:
- Если цена была медвежьей и пробивает предыдущий максимум, это бычий MSS
- Если цена была бычьей и пробивает предыдущий минимум, это медвежий MSS
Использование в торговле
- `BOS` больше ориентирован на продолжение тренда
- `MSS` больше ориентирован на разворот
- Лучшие входы обычно происходят после ретеста `Order Block` или `FVG`
4. Блоки ордеров
`Order Block` — это последняя противоположная свеча перед прорывом структуры. Обычно рассматривается как зона реакции спроса/предложения.
Показать блоки ордеров
При включении индикатор смотрит назад после `BOS` или `MSS` и рисует зону последней противоположной свечи.
Значение
- Бычий OB: после бычьего прорыва используется последняя медвежья свеча
- Медвежий OB: после медвежьего прорыва используется последняя бычья свеча
Когда цена начинает взаимодействовать с зоной, она отмечается как смягчённая.
Использование теней в блоках ордеров
Это контролирует, насколько широко рисуется блок:
- `Да`: использовать полный диапазон свечи, более широкая зона
- `Нет`: использовать более узкую основную зону
Рекомендации:
- Используйте `Да` для более широкой, более консервативной зоны
- Используйте `Нет` для более узкой, более точной зоны
Стратегия блоков ордеров
Типичный рабочий процесс:
1. Ждать `BOS` или `MSS`
2. Отметить соответствующий OB
3. Ждать ретест
4. Искать подтверждение перед входом
Не рассматривайте OB как гарантированную точку разворота. Это зона повышенного интереса, а не уверенность.
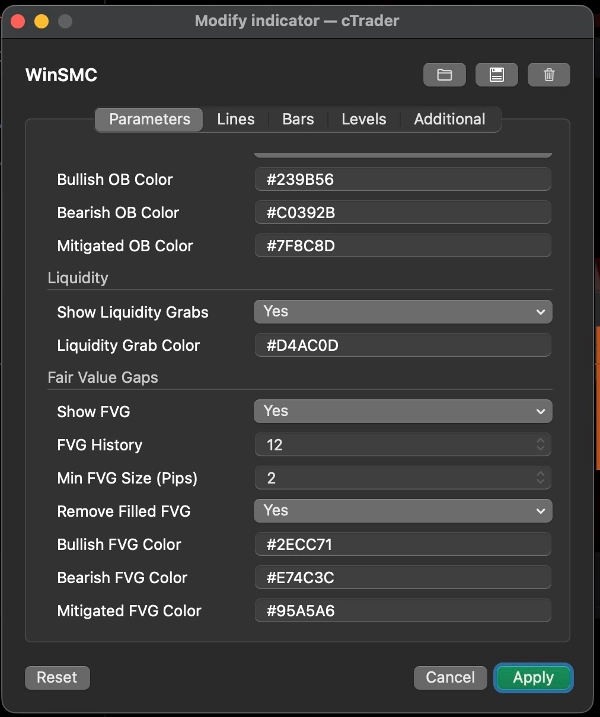
5. Захваты ликвидности / выметания
`Liquidity Grab` означает, что цена пробегает выше предыдущего максимума или ниже предыдущего минимума, затем закрывается обратно внутри.
В этом индикаторе:
- `Buy-side sweep`: цена пробивает предыдущий максимум и закрывается ниже него
- `Sell-side sweep`: цена пробивает предыдущий минимум и закрывается выше него
Это обычно означает, что рынок захватил ликвидность и может готовиться к следующему движению.
Важно
Сам по себе выметание не является торговым сигналом.
Лучше рассматривать его как:
- Предупреждение о том, что ликвидность была захвачена
- Подсказку для настройки
- Причину ждать `MSS` или `BOS`
Распространённое использование
- После `Buy-side sweep` медвежий `MSS` может поддержать короткую позицию
- После `Sell-side sweep` бычий `MSS` может поддержать длинную позицию
6. FVG
`FVG` — это разрыв справедливой стоимости, созданный дисбалансом из трёх свечей.
Показать FVG
При включении индикатор рисует видимые зоны FVG.
Правило обнаружения
- Бычий FVG: максимум первой свечи ниже минимума третьей свечи
- Медвежий FVG: минимум первой свечи выше максимума третьей свечи
Минимальный размер FVG (в пунктах)
Это фильтрует маленькие разрывы.
- Единица: `пункты`
- Большое значение = меньше, но более значимых FVG
- `0` = без фильтра по размеру
Полезно, когда график загромождён или когда маленькие разрывы в 1 пиксель не подходят для вашего рабочего процесса.
Удалять заполненные FVG
При включении полностью заполненные FVG удаляются с графика.
Стратегия FVG
Два распространённых подхода:
1. Откат тренда
- Ждать `BOS` или `MSS`
- Ждать, пока цена откатится в зону FVG
- Торговать в направлении структуры
2. Вход на основе подтверждения
- Следить за выметанием
- Ждать `MSS`
- Использовать FVG как конечную зону отката
7. Рекомендуемые стили торговли
Стратегия A: Продолжение тренда
Лучше всего, когда рынок явно трендовый.
Рабочий процесс:
1. Ждать `BOS`
2. Отметить OB
3. Искать откат в OB или FVG
4. Входить только после реакции цены
Это классический подход следования за трендом.
Стратегия B: Выметание, затем разворот
Лучше всего, когда рынок волатилен и склонен к ложным пробоям.
Рабочий процесс:
1. Обнаружить `Buy-side sweep` или `Sell-side sweep`
2. Ждать противоположный `MSS`
3. Использовать OB или FVG как зону отката
4. Входить после подтверждения
Это сильнее, чем торговля только по выметанию.
Стратегия C: Выметание + MSS + Совпадение OB/FVG
Это один из самых чистых способов использования индикатора.
Рабочий процесс:
1. Получить выметание
2. Получить MSS
3. Ждать ретест OB или FVG
4. Торговать только когда зоны перекрываются
Это снижает преждевременные входы.
8. Быстрые рекомендации по настройкам
- `Swing Length`: начните с 5 или 7
- `Break Uses Close`: включите для более консервативного взгляда
- `Order Block Uses Wicks`: включите для более широких зон
- `Min FVG Size (Pips)`: начните с 2.0 и настройте по инструменту
- `Structure History` / `Order Block History` / `FVG History`: настройте для удобочитаемости графика
9. Заключительное замечание
`WinSMC` лучше использовать как карту структуры, а не как триггер с одним сигналом.
Самый надёжный рабочий процесс:
- Определить направление тренда
- Следить за выметанием ликвидности
- Ждать MSS или BOS
- Использовать OB или FVG как зону входа
- Входить только после подтверждения
Сводка
The indicator helps traders analyze price action by marking swing highs and lows, confirming valid swing points based on customizable swing length, and distinguishing breaks using candle closes or wick extremes. Order Blocks are displayed as supply/demand zones derived from the last opposite candle before a structure break, with options to adjust zone width. Liquidity Sweeps indicate price movements beyond prior highs or lows that close back inside, signaling potential setups rather than direct trade signals. FVG zones are identified by three-candle imbalances and can be filtered by minimum size and removed once filled.
WinSMC supports multiple trading strategies, including trend continuation after BOS, reversal setups following liquidity sweeps and MSS, and confluence-based entries combining sweeps, MSS, and retests of Order Blocks or FVGs. It is intended as a confirmation and structure mapping tool rather than an automated trading system, aiding traders in timing entries with contextual market information.

![Логотип продукта "[CB] Pivot Points Pro"](https://cdn.ctrader.com/image/webp/43463c82-67b0-4f10-a4ba-901bba091d81_32594)


