
ATR_RR_EMASignalPanel
指标
1 购买
版本 1.0, Dec 2025
Windows 版、Mac 版
5.0
评价:2
说明
🔧 ATR_RR_SignalPanel — 技术与详细说明 (EN) 🧠📈
ATR_RR_SignalPanel 是一个 覆盖指标,用于 cTrader,通过 快速 EMA 与慢速 EMA 机制生成 趋势变化入场信号,然后构建完整的 虚拟交易框架(入场 🏁,止损 🛑,最终止盈 🎯,中间目标 🟢),使用 基于 ATR 的风险规模和可配置的 风险回报比乘数 ⚖️。
🧭 核心逻辑(信号引擎)🚦
- 指标计算:
-
- 快速 EMA ⚡ 和 慢速 EMA 🐢 基于 收盘价。
- ATR(Wilder 平滑) 🌡️ 用于基于波动性的止损距离。
- 定义一个 趋势机制 如下:
-
- 牛市趋势 🟢 当
快速 EMA > 慢速 EMA - 熊市趋势 🔴 当
快速 EMA < 慢速 EMA
- 牛市趋势 🟢 当
- 当牛市/熊市状态 与前一根K线不同时,触发 趋势变化 🔁(等同于 Pine 的
bullTrend != bullTrend[1])。
🎯 入场条件(买入/卖出)🟩🟥
当发生 趋势变化时:
- 买入信号 🟢 如果:
-
- 牛市趋势处于激活状态 且 检测到趋势变化
- 可选的蜡烛确认 ✅:收盘价 > 开盘价(看涨蜡烛)
- 卖出信号 🔴 如果:
-
- 熊市趋势处于激活状态 且 检测到趋势变化
- 可选的蜡烛确认 ✅:收盘价 < 开盘价(看跌蜡烛)
🧪 虚拟仓位管理(非 cBot)🧩
该指标 不 下单,而是模拟一个内部“虚拟仓位”:
- 在新的买入/卖出信号时设置:
-
- 入场价格 = 当前收盘价 🏁
- 止损 = 蜡烛极值 ± ATR × 乘数 🛑
- 最终止盈 = 入场价 ±(风险 × 风险回报比)🎯
- 中间止盈级别 = 1R、2R、…直到 floor(RR)-1 的步骤 🟢
- 逐根K线监控价格动作:
-
- 如果 最终止盈 被触及 ➜ 标记 🎯 并关闭虚拟仓位 ✅
- 如果 止损 被触及 ➜ 标记 🛑 并关闭虚拟仓位 ❌
- 中间止盈命中仅 记录一次 🧷
🔁 失效逻辑(激活时相反信号)⚠️
如果在存在相反方向虚拟交易时收到新信号:
- 之前的入场被标记为 失效 ⚠️(INV 买入 / INV 卖出)
- 之前的虚拟仓位被终止 🧯
- 在新方向创建新的虚拟仓位 🔄
🧼 多实例安全(同图多份)🧩🧩
每个指标实例生成唯一内部 ID 🆔,因此:
- 一个实例的线条/文本 不会覆盖 另一个实例 ✅
- 你可以同时运行多个配置(例如,剥头皮 + 摆动)🧠📊
🧯 防杂乱控制(标记限制器)🧹✨
为了保持图表清晰,它可以:
- 限制绘制的文本标记数量(买入/卖出/止盈/止损/失效/TP1…)🧾
- 当超过限制时自动删除较旧标记 ♻️
🧷 可选“保留最后风险线”🧠📌
启用时,最后的入场/止损/止盈线在 TP/SL 关闭后仍然可见:
- 非常适合交易后复盘 🧑🔬
- 非常适合交易日志记录 📒✅
⚙️ 参数 — 详细说明 (EN) 🔍📌
📈 信号与风险核心
⚡ 快速 EMA
- 作用 🧠: 设置用于检测机制变化的快速 EMA 周期。
- 效果 📊: 数值越低 = 反应越快 ➜ 信号更多;数值越高 = 趋于平滑 ➜ 信号更少。
- 典型范围 🎛️: 快速市场为 3–10 ⚡,较平稳设置为 10–20 🐢
🐢 慢速 EMA
- 作用 🧠: 设置作为趋势基线的慢速 EMA 周期。
- 效果 📊: 慢速 EMA 越高 = 过滤越强 ➜ 趋势变化触发越少。
- 典型范围 🎛️: 根据风格不同为 13–55 🧭
🌡️ ATR 周期
- 作用 🧠: 控制 ATR 的波动性测量长度。
- 效果 📏: 短 ATR 反应快(止损更紧),长 ATR 稳定(止损更稳)。
- 典型范围 🎛️: 10–21 是常见值 ✅
🛑 止损乘数(ATR)
- 作用 🧠: 定义止损距离的 ATR 单位数。
- 多头 🟢:
止损 = 最低价 - ATR * 乘数 - 空头 🔴:
止损 = 最高价 + ATR * 乘数 - 效果 🎯: 乘数越高 = 止损越宽(止损次数少,风险大);乘数越低 = 止损越紧(止损次数多)。
- 典型值 🎛️: 根据波动性不同为 0.3–2.0 🌪️
⚖️ 风险回报比 (R:R)
- 作用 🧠: 将“风险”距离乘以倍数计算最终止盈。
- 公式 📌:
-
- 风险 = |入场价 − 止损价|
- 最终止盈 = 入场价 ± 风险 × 风险回报比 🎯
- 中间止盈 🟢: TP1 在 1R,TP2 在 2R,…直到
floor(RR)-1 - 示例 🧪: RR=3 ➜ TP1 (1R), TP2 (2R), 最终止盈 (3R) 🎯🎯🎯
✅ 需要蜡烛确认
- 作用 🧠: 在信号K线上添加蜡烛方向验证。
- 买入 🟢: 需要收盘价 > 开盘价
- 卖出 🔴: 需要收盘价 < 开盘价
- 效果 🧽: 过滤弱反转,减少噪音,可能延迟入场 ⏳
📌 EMA 显示
👁️ 显示快速 EMA
- 作用 🧠: 显示/隐藏快速 EMA 线。
- 使用场景 💡: 如果想要干净的图表可隐藏 🧼
👁️ 显示慢速 EMA
- 作用 🧠: 显示/隐藏慢速 EMA 线。
- 使用场景 💡: 保持可见以提供趋势背景 🧭
🎛️ 视觉控制(杂乱管理)🧹✨
🚦 显示信号
- 作用 🧠: 显示/隐藏买入/卖出标记。
- 包含 🧷: 仅买入 🟢 / 卖出 🔴 标记
- 提示 💡: 关闭以启用“仅线条”模式 📏
🏷️ 显示止盈标签
- 作用 🧠: 显示/隐藏如 TP1、TP2 等标签。
- 效果 🧼: 关闭可减少高时间框架上的文本噪音 📉
- 注意 🧷: 标签每次止盈命中只显示一次 ✅
⚠️ 显示失效标记
- 作用 🧠: 显示/隐藏 INV 买入 / INV 卖出 标记。
- 使用场景 🧠: 当你想研究信号反转时非常有用 🔁
🎯🛑 显示最终止盈/止损标记
- 作用 🧠: 显示/隐藏最终止盈和止损标记。
- 使用场景 📒: 非常适合复盘结果分布 🎲
📏 显示风险线(入场/止损/止盈)
- 作用 🧠: 在图表上绘制入场 🏁、止损 🛑、最终止盈 🎯 线。
- 效果 📌: 立即可视化虚拟交易结构 🧠
🟢 显示中间止盈线
- 作用 🧠: 绘制 TP1/TP2/... 级别的虚线。
- 提示 🧼: 如果图表变得过于“绿色意大利面”可禁用 🍝🟢
📌 保留最后风险线
- 作用 🧠: 在虚拟退出(止盈/止损)后保持最后的入场/止损/止盈线可见。
- 为何有用 📒: 非常适合日志记录和交易后分析 🧑🔬✅
🧾 图表上最大标记数(0=无限制)
- 作用 🧠: 限制指标在图表上保留的文本对象数量。
- 工作原理 ♻️: 超过限制时,自动删除最旧的标记。
- 推荐 🎛️: 根据时间框架和历史深度为 80–200 🕰️
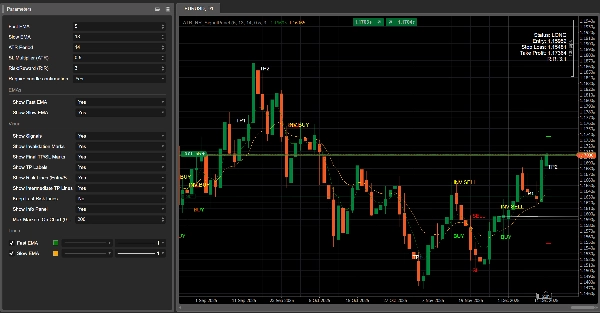
🧾 显示信息面板
- 作用 🧠: 在图表上显示紧凑的状态面板。
- 显示内容 📋: 状态(多头/空头/无仓位)、入场、止损、止盈、计算的风险回报比。
摘要
AI 摘要
ATR_RR_EMASignalPanel is an overlay indicator designed for the cTrader platform that identifies trend-change entry signals based on the relationship between a fast and slow Exponential Moving Average (EMA). It calculates a trend regime where a bull trend is indicated when the fast EMA is above the slow EMA, and a bear trend when below. A trend change signal triggers when this relationship flips from one bar to the next.
The indicator simulates virtual trades by setting entry price, stop loss, and take profit levels using Average True Range (ATR) for volatility-based risk sizing combined with a configurable risk-to-reward multiplier. It tracks intermediate take profit levels and monitors price action bar-by-bar to mark virtual trade outcomes without placing actual orders.
Key features include optional candle confirmation for signals, multi-instance support to run multiple configurations on the same chart, and visual clutter controls such as limiting markers and toggling display of EMAs, signals, and risk lines. An info panel provides a compact status overview of virtual positions. Parameters allow customization of EMA periods, ATR period, stop loss multiplier, and risk-reward ratio to adapt to different trading styles and market conditions.
Supported markets include Forex, indices, commodities, stocks, and cryptocurrencies, with symbols like GBPUSD, EURUSD, XAUUSD, NAS100, and BTCUSD among the tagged assets.
指标配置
客户评价
5.0
评价:2
5 | 100 % | |
4 | 0 % | |
3 | 0 % | |
2 | 0 % | |
1 | 0 % |
客户评价
December 21, 2025
What stood out was the opening read should not drive the whole decision. It needs a few bad trades in the sample too.
December 16, 2025
The reason it feels usable is the trade idea gets a pause before execution, and half size is enough at the start.
讨论
常见问答
Signal
Indices
Commodities
GBPUSD
RSI
Bollinger
Fibonacci
Scalping
AI
XAUUSD
NAS100
MACD
BTCUSD
Forex
Breakout
EURUSD
NZDUSD
Martingale
Prop
ZigZag
Supertrend
Fair Value Gap
SMC
Crypto
Grid
Stocks
ATR
USDJPY
VWAP
cTrader Store 提供的所有产品,包括交易机器人、指标和插件,均由第三方开发者提供,仅供信息参考和技术访问之用。cTrader Store 并非经纪商,不提供投资建议、个人推荐或任何未来业绩保证。


价格
42.11M
交易量
6.13M
盈利点数
211
销售
8.14K
免费安装