
说明
大蜡烛检测器
(作者 Avydel Talbo – The5%ers 和 OFP 的 Prop Firm 交易员)
现已支持 cTrader!
ATR 大蜡烛检测器最初为 MT5 开发,由 Avydel Talbo 设计,是一款强大的工具,旨在帮助交易者高效且准确地识别主要价格动作区域和重要蜡烛图形态。
概述
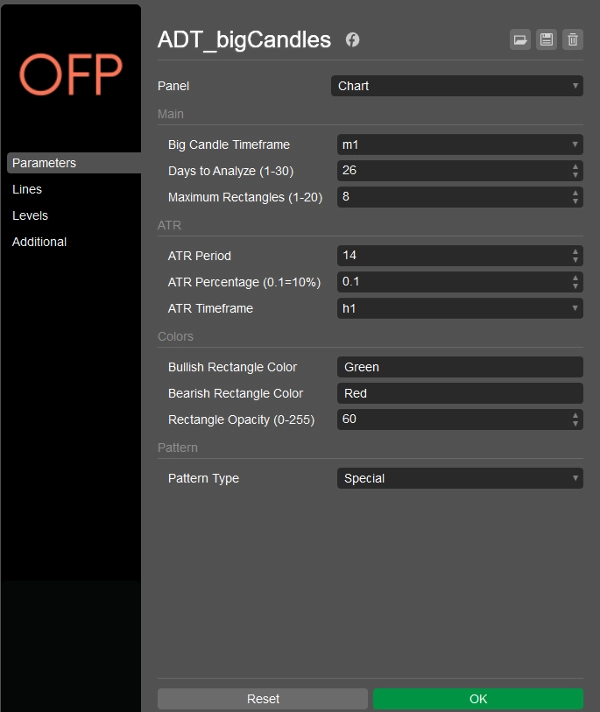
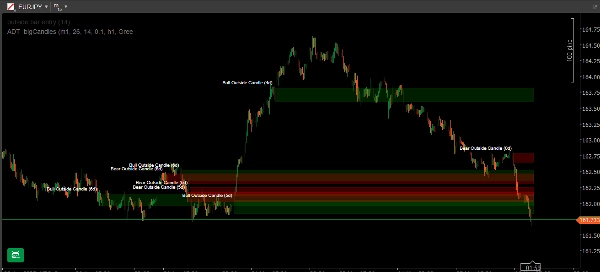
ATR 大蜡烛检测器会扫描您图表中用户定义周期内最大且最重要的蜡烛。利用平均真实波幅(ATR)作为波动性过滤器,它用持久的彩色矩形突出显示这些“大蜡烛”。每个区域都标注了蜡烛的图形类型和时间,为各级交易者提供清晰的视觉参考。
主要功能
- 基于 ATR 的过滤:
仅检测超过可自定义 ATR 阈值的蜡烛,聚焦真正重要的价格波动。 - 多种图形检测:
-
- 标准模式:查找所有符合 ATR 标准的蜡烛。
- 特殊模式:筛选经典价格动作图形,如外包线、吞没蜡烛、十字星、Marubozu、锤子线、流星线、针状线和纺锤线(自动标注)。
- 持久矩形:
用彩色矩形(看涨或看跌)标记每个大蜡烛,矩形会持续显示在图表上,便于参考——非常适合绘制供需区和支撑/阻力区。 - 可定制设置:
调整时间框架、扫描天数、ATR 周期、矩形外观等。 - 重叠管理:
防止同类型矩形重叠,保持图表整洁。 - 图形标注:
每个区域标注方向、图形类型及发生天数。
工作原理
- 扫描您选择时间框架内最近的蜡烛(最多回溯30天)。
- 计算 ATR 以设定动态范围阈值。
- 检测并按范围排名最大蜡烛。
- 绘制并标注矩形,便于快速分析。
适用对象
- 绘制机构交易动向的 Prop Firm 和散户交易者
- 价格动作和技术分析交易者
- 任何希望自动识别高影响力蜡烛和区域的人
关于作者:
The5%ers 和 OFP 的专业 Prop Firm 交易员,拥有丰富的价格动作和区域交易经验。该指标基于真实交易需求开发,并在实盘交易环境中每日使用。
非常适合希望自动化区域检测并提升价格动作分析的交易者。
摘要
AI 摘要
The ADT_bigCandles indicator, developed by professional prop firm trader Avydel Talbo, is designed for cTrader to identify significant candlestick patterns and major price action zones. It scans charts over a user-defined period (up to 30 days) and uses the Average True Range (ATR) to filter and detect only the largest, most volatile candles. These "big candles" are highlighted with persistent, color-coded rectangles indicating bullish or bearish moves, aiding in mapping supply/demand and support/resistance zones.
Key features include two detection modes: Standard Mode, which finds all candles exceeding the ATR threshold, and Special Mode, which filters classic price action patterns such as Outside Bars, Engulfing Candles, Doji, Marubozu, Hammer, Shooting Star, Pin Bars, and Spinning Top, with automatic labeling. The indicator prevents overlapping rectangles of the same type for chart clarity and allows customization of timeframe, ATR period, scan duration, and rectangle appearance. Each highlighted zone is labeled with candle direction, pattern type, and age.
This tool is suitable for prop firm and retail traders focused on price action and technical analysis, particularly those automating the identification of high-impact candles and zones for enhanced trading decisions.
指标配置
客户评价
5.0
评价:2
5 | 100 % | |
4 | 0 % | |
3 | 0 % | |
2 | 0 % | |
1 | 0 % |
客户评价
May 10, 2025
Ngl, loss rules are easier to respect and that is enough to keep testing it. 30 days gives the idea room.
讨论
常见问答
Prop
ATR
cTrader Store 提供的所有产品,包括交易机器人、指标和插件,均由第三方开发者提供,仅供信息参考和技术访问之用。cTrader Store 并非经纪商,不提供投资建议、个人推荐或任何未来业绩保证。


价格
注册日期 06/05/2025
2
销售