


说明
概述:
厌倦了传统的超级趋势指标在市场突变时滞后? AI超级趋势MTF 通过整合K近邻(K-NN)机器学习算法重新定义趋势跟踪。它不断从最新的价格动作(RSI、ATR、动量)中学习,并自动调整其灵敏度,以消除震荡市场中的错误信号,同时即时捕捉大规模突破。
主要特点:
- 🤖 机器学习引擎: 利用不断扩展的记忆库和动态特征加权来区分真实趋势和市场噪音。
- 📊 多时间框架(MTF)投影: 洞察全局!可将最多两个更高时间框架(例如1小时和日线)直接投影到当前较低时间框架的图表上。采用严格的位运算逻辑,确保 零重绘 且无未来数据泄露。
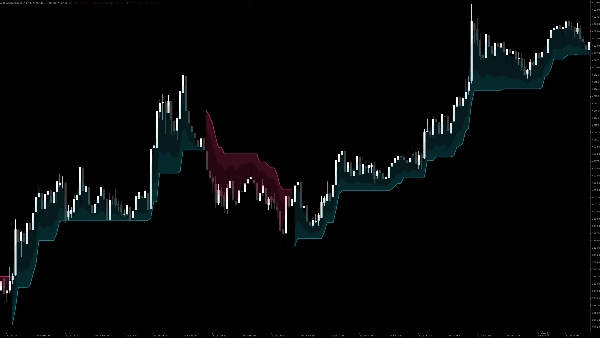
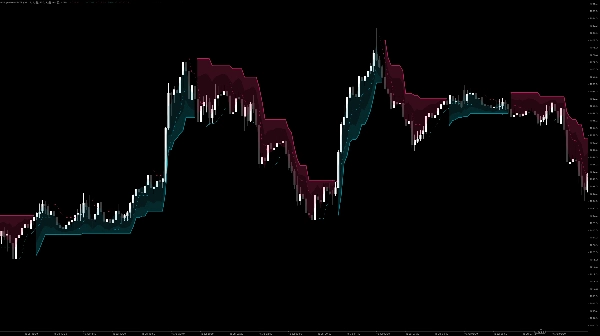
- ✨ 动态发光云层: 令人惊艳的视觉升级。显示平滑且不干扰的三层渐变云层,直观指示当前趋势的强度及支撑/阻力区域。
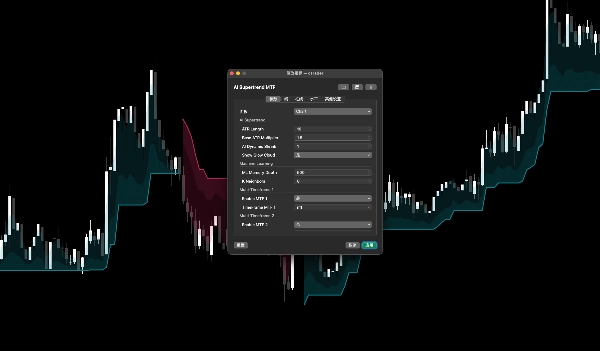
- ⚙️ 高度可定制: 可直接从cTrader原生参数面板调整AI记忆深度、K近邻数和MTF粒度。
使用方法(用户手册):
- 附加到图表: 将指标应用于您喜欢的时间框架。主趋势线将立即显示当前AI计算的方向。
- 启用MTF(可选): 在设置中向下滚动至
Multi-Timeframe 1和Multi-Timeframe 2。勾选“启用”框并选择您想要的更高时间框架。虚线将出现,显示宏观趋势。 - 交易策略:
-
- 买入信号: 当主趋势线变为青色(价格下方)且MTF更高时间框架线也为青色时(趋势一致)。
- 卖出信号: 当主趋势线变为红色(价格上方)且MTF更高时间框架线也为红色时。
- 退出: 使用发光云带作为动态移动止损位。
摘要
AI summary
AI Supertrend MTF is a trend-following indicator that integrates a K-Nearest Neighbors (K-NN) machine learning algorithm to reduce lag and false signals typical of traditional Supertrend indicators. It continuously learns from recent price action metrics including RSI, ATR, and momentum, adapting its sensitivity to distinguish true trends from market noise and to capture breakouts promptly.
Key features include multi-timeframe (MTF) projection, allowing users to overlay trend information from up to two higher timeframes onto the current chart without repainting or future data leaks. The indicator visually represents trend strength and support/resistance zones through dynamic, three-layer glowing clouds. Users can customize AI memory depth, K-neighbors, and MTF settings via the native parameter panel.
To use, apply the indicator to any timeframe to see the AI-calculated trend direction. Optional MTF lines display macro trends from higher timeframes. Buy and sell signals are generated when the main trendline and MTF lines align in color (cyan for buy, red for sell). The glowing cloud bands serve as dynamic trailing stop-loss levels.
This indicator supports visualization, signals, and filtering functions, and requires bar, tick, and volume data inputs. It is categorized under trend indicators and incorporates RSI and ATR for momentum and volatility analysis.
Key features include multi-timeframe (MTF) projection, allowing users to overlay trend information from up to two higher timeframes onto the current chart without repainting or future data leaks. The indicator visually represents trend strength and support/resistance zones through dynamic, three-layer glowing clouds. Users can customize AI memory depth, K-neighbors, and MTF settings via the native parameter panel.
To use, apply the indicator to any timeframe to see the AI-calculated trend direction. Optional MTF lines display macro trends from higher timeframes. Buy and sell signals are generated when the main trendline and MTF lines align in color (cyan for buy, red for sell). The glowing cloud bands serve as dynamic trailing stop-loss levels.
This indicator supports visualization, signals, and filtering functions, and requires bar, tick, and volume data inputs. It is categorized under trend indicators and incorporates RSI and ATR for momentum and volatility analysis.
指标配置
指标分类
趋势
输出类型
可视化
过滤器
信号
数据要求
仅 K 线
跳动点数据
交易量
支持的信号
交叉
突破
反转
趋势强度
波动性
突破水平位
客户评价
0.0
评价:0
客户评价
该产品尚无评价。已经试过了?抢先告诉其他人!
讨论
常见问答
Supertrend
RSI
ATR
cTrader Store 提供的所有产品,包括交易机器人、指标和插件,均由第三方开发者提供,仅供信息参考和技术访问之用。cTrader Store 并非经纪商,不提供投资建议、个人推荐或任何未来业绩保证。
该作者的其他作品






















价格
534.4M
交易量
9.76M
盈利点数
4
销售