
Opis
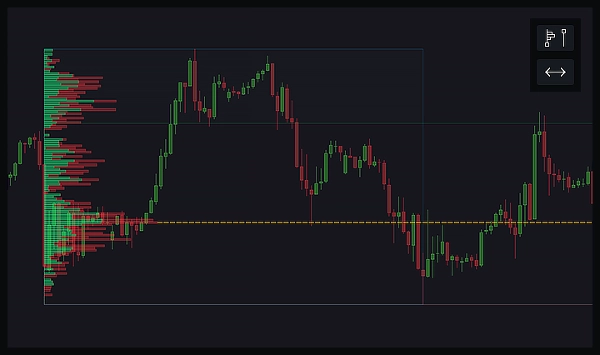
Profil wolumenu o stałym zakresie to narzędzie, które pokazuje, ile aktywności handlowej miało miejsce na różnych poziomach cenowych w określonym zakresie na wykresie. Rysujesz prostokąt nad interesującym Cię obszarem, a profil wyświetla poziome paski wskazujące wolumen transakcji na każdym poziomie cenowym w tym zakresie. Pomaga to zobaczyć, gdzie miały miejsce największe zakupy i sprzedaże, podkreślając kluczowe poziomy cenowe, które mogą być ważne przy podejmowaniu decyzji handlowych.
Kluczowe elementy profilu wolumenu o stałym zakresie to:
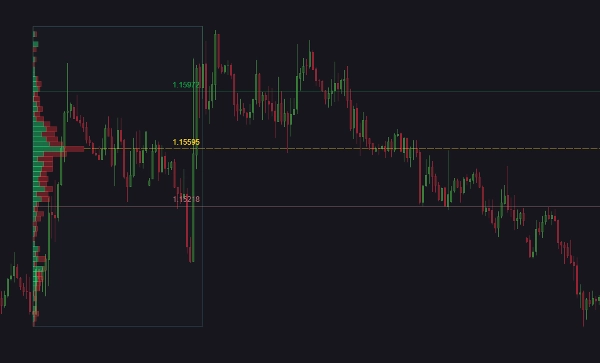
- Punkt Kontroli (POC): Poziom cenowy z najwyższym wolumenem handlu w wybranym zakresie. Często jest postrzegany jako istotny poziom wsparcia lub oporu, ponieważ odzwierciedla cenę, przy której miało miejsce dużo aktywności handlowej.
- Wysoki Obszar Wartości (VAH): Górna granica zakresu cenowego, w którym miało miejsce 70% całkowitego wolumenu handlu. Ceny powyżej tego poziomu są uważane za mniej handlowane i potencjalnie przewartościowane.
- Niski Obszar Wartości (VAL): Dolna granica zakresu cenowego, w którym miało miejsce 70% całkowitego wolumenu handlu. Ceny poniżej tego poziomu są uważane za mniej handlowane i potencjalnie niedowartościowane.
Te linie pomagają traderom zidentyfikować istotne poziomy cenowe, które mogą działać jako wsparcie lub opór. Rozumiejąc, gdzie skoncentrowany jest główny wolumen handlu, traderzy mogą podejmować bardziej świadome decyzje dotyczące potencjalnych ruchów cen, punktów wejścia i wyjścia.
Na przykład, jeśli aktualna cena znajduje się blisko POC, może to wskazywać na silny poziom wsparcia lub oporu. Jeśli cena jest w obszarze wartości, sugeruje to, że znajduje się w zakresie uczciwej wartości, podczas gdy ceny poza obszarem wartości mogą być postrzegane jako potencjalne punkty wybicia lub załamania.
Co robi ten wskaźnik:
Ten wskaźnik wzbogaca Twój wykres handlowy o potężną analizę profilu wolumenu oraz konfigurowalne alerty. Dzięki dwóm intuicyjnym przyciskom możesz łatwo rysować profile wolumenu o stałym zakresie oraz rozszerzać lub kurczyć kluczowe poziomy do nieskończoności. Profil wolumenu można wizualizować w dwóch trybach: całkowitym lub pasków wzrostu i spadku. Dostosuj liczbę poziomów, rozdzielczość danych (Precyzyjna lub Szybka) oraz rozmiar obszaru wartości do swoich potrzeb.
Zakresy magnetyczne automatycznie aktualizują się na podstawie ostatniej świecy, zapewniając aktualność analizy. Możesz także dostosować wygląd i zachowanie profilu oraz jego elementów, w tym linii POC, VAH i VAL. Alerty można ustawić na dotknięcie ceny, z opcjami wywołania działań takich jak uruchamianie lub zatrzymywanie cBotów oraz zamykanie pozycji. Alerty mogą być dostarczane za pomocą dźwięku, wyskakujących okienek cTrader, wiadomości Telegram (z opcjonalnymi zrzutami ekranu) oraz e-maili.
Funkcje:
- Profil wolumenu o stałym zakresie: Narysuj prostokąt, aby zobaczyć profil wolumenu wybranego zakresu.
- Rozszerzanie/kurczenie linii: Rozszerzaj lub kurcz linie POC, VAH i VAL do nieskończoności.
- Tryby profilu wolumenu: Wybierz między całkowitym wolumenem lub paskami wzrostu i spadku.
- Konfigurowalne poziomy i rozdzielczość: Wybierz liczbę poziomów i rozdzielczość (Precyzyjna lub Szybka).
- Regulowany obszar wartości: Ustaw rozmiar obszaru wartości.
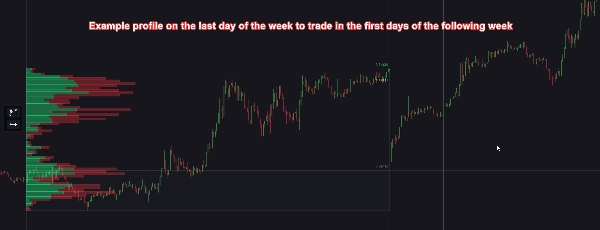
- Zakresy magnetyczne: Automatycznie zmieniają rozmiar zakresów, aby dopasować się do ostatniej świecy, aktualizowane co 1–10 minut lub przy zamknięciu słupka.
- Konfigurowalny wygląd: Zmieniaj pozycję, rozmiar i styl przycisków, linii i pasków wolumenu.
- Alerty na dotknięcie ceny: Otrzymuj powiadomienia, gdy cena dotknie linii POC, VAH lub VAL.
- Integracja z cBotami: Uruchamiaj lub zatrzymuj cBoty na podstawie alertów.
- Zarządzanie pozycjami: Zamykaj pozycje, gdy wystąpią alerty, z konfigurowalnymi opcjami dla każdej linii (POC, VAH i VAL).
- Metody alertów: Otrzymuj alerty za pomocą dźwięku, wyskakujących okienek cTrader, wiadomości Telegram (z opcjonalnymi zrzutami ekranu) oraz e-maili.
- Optymalizacja wydajności: Opcja automatycznego usuwania przeszłych zakresów niewidocznych na wykresie w celu poprawy wydajności.
- Globalna kontrola alertów: Łatwe włączanie lub wyłączanie wszystkich alertów z tego wskaźnika.
- Przewodnik użytkownika: Możesz łatwo otworzyć przewodnik użytkownika tego wskaźnika za pomocą małego przycisku na wykresie.
Podsumowanie
The indicator offers two visualization modes: total volume or separate up and down volume bars. It features customizable settings for the number of volume levels, data resolution (Precise or Fast), and value area size. Magnetic ranges automatically update based on the latest candle to keep analysis current. Users can expand or contract POC, VAH, and VAL lines infinitely.
Alerts can be configured for price touches on these key levels, with notifications via sound, platform pop-ups, Telegram (including optional screenshots), and email. Alerts can trigger actions such as starting/stopping cBots or closing positions. The indicator also supports customizable appearance, performance optimization by auto-deleting out-of-view ranges, and global alert control. A user guide is accessible directly from the chart interface.
Opinie klientów
5 | 67 % | |
4 | 0 % | |
3 | 33 % | |
2 | 0 % | |
1 | 0 % |


![Logo „[Hamster-Coder] Bollinger Bands”](https://cdn.ctrader.com/image/webp/21d8e5d6-fb11-4bac-b9ee-cd05c2b76804_30327)


