
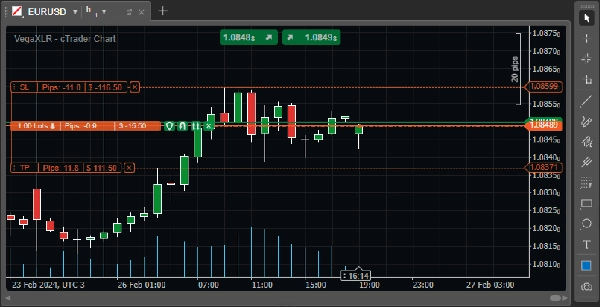
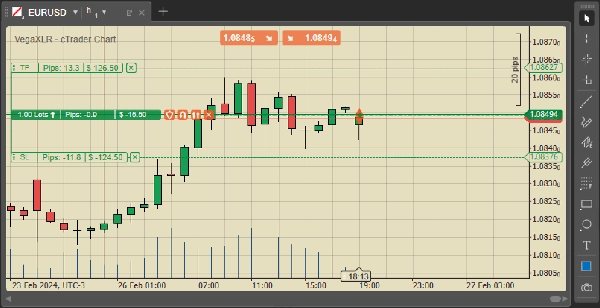
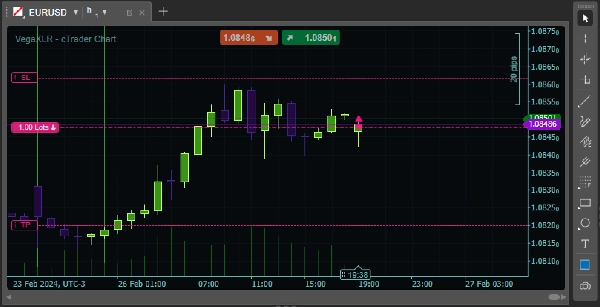
VegaXLR - cTrader Chart Themes
Wskaźnik
336 pobrania
Wersja 1.1, Nov 2025
Windows, Mac
5.0
Opinie: 3
Opis
To jest darmowy pakiet motywów wykresów cTrader. Te motywy nie zmienią konfiguracji twoich szablonów wykresów, zmienią tylko kolory wykresu.
Jak zastosować:
- Zainstaluj plik jak każdy inny wskaźnik — po prostu kliknij go dwukrotnie.
- Dodaj wskaźnik do swojego wykresu.
- Wybierz preferowany motyw.
- Gdy będziesz zadowolony z motywu, usuń wskaźnik z wykresu.
- Zapisz motyw jako szablon wykresu. Gotowe!
Szukasz więcej narzędzi cTrader? Sprawdź sekcję "Więcej od tego autora" poniżej. Znajdziesz tam różnorodne wskaźniki i cBoty, w tym alerty średnich kroczących, profil wolumenu o stałym zakresie, alerty linii trendu i wiele więcej!
Podsumowanie
Podsumowanie AI
VegaXLR - cTrader Chart Themes is a free pack of customizable chart color themes designed for the cTrader trading platform. The product allows users to change the visual color scheme of their charts without altering any existing chart template configurations. Installation involves adding the indicator to a chart, selecting a preferred theme, then removing the indicator and saving the theme as a chart template. This tool supports various market types including Forex, Indices, Commodities, Crypto, and Stocks, providing a straightforward way to personalize chart appearance across these markets on cTrader.
Profil wskaźnika
Opinie klientów
5.0
Opinie: 3
5 | 100 % | |
4 | 0 % | |
3 | 0 % | |
2 | 0 % | |
1 | 0 % |
Opinie klientów
March 31, 2026
September 18, 2025
Dyskusja
Częste pytania
Prop
Forex
Indices
Commodities
Crypto
Stocks
Produkty dostępne za pośrednictwem cTrader Store, w tym boty handlowe, wskaźniki i wtyczki, dostarczane są przez deweloperów zewnętrznych i udostępniane wyłącznie w celach informacyjnych oraz w celu zapewnienia dostępu technicznego. cTrader Store nie jest brokerem i nie zapewnia doradztwa inwestycyjnego, nie udziela spersonalizowanych rekomendacji ani nie gwarantuje przyszłych wyników.


Cena
231
Sprzedaż
692
Bezpłatne instalacje