
Opis
ZigZag Pro — Zaawansowane wykrywanie wahnięć z progiem ATR, potwierdzeniem fraktalnym i kolorowymi segmentami. Czysta struktura rynku, nieprzemalowujące się potwierdzone pivoty, zoptymalizowana wydajność dla wykresów na żywo.
Hasło: Zaawansowane wykrywanie wahnięć z progiem ATR, Potwierdzeniem Fraktalnym i Kolorowymi Segmentami. Potwierdzone pivoty są nieprzemalowujące się.
Przegląd
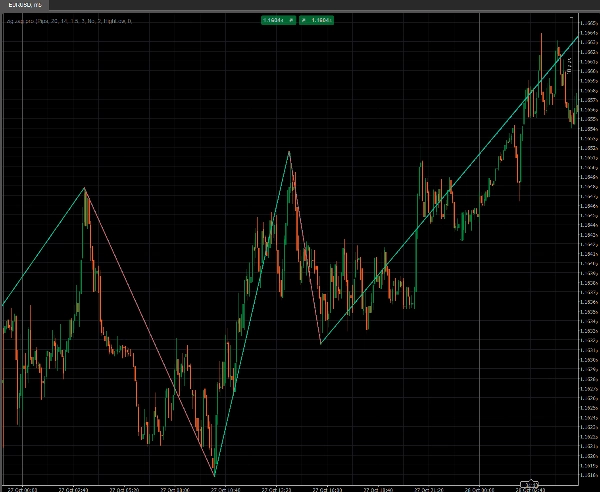
ZigZag Pro jest stworzony dla traderów dyskrecjonalnych i systematycznych, którzy potrzebują czystego, powtarzalnego odczytu struktury rynku. Wykrywa znaczące wahnięcia, oznacza pivoty i łączy odcinki kolorowymi segmentami. Próg odwrócenia może być automatyczny (ATR) lub stały (pipsy/procent), dzięki czemu wskaźnik dostosowuje się do różnych instrumentów i reżimów zmienności.
Dlaczego wybrać Pro
- ✅ Dynamiczny próg ATR z okresem i mnożnikiem
- ✅ Potwierdzenie fraktalne (opcjonalne) dla bardziej solidnej walidacji pivotów
- ✅ Kolorowe segmenty (Wzrost/Spadek) do natychmiastowego odczytu kierunku impulsu
- ✅ Etykiety pivotów (H/L + sformatowana cena), opcjonalne
- ✅ Rozszerzone źródła cen: HL / Close / HL2 / HLC3 / HLCC4
- ✅ Filtr minimalnego TickVolume (0 = wyłączony)
- ✅ Podgląd ostatniej nogi na żywo (opcjonalne rozszerzenie)
Potwierdzone pivoty nie przemalowują się. Tylko niedokończona ostatnia noga może się przesuwać, aż do potwierdzenia kolejnego pivotu (standardowe zachowanie ZigZag).
Główne funkcje
- Tryb odchylenia: Pipsy • Procent • ATR (Wykładniczy ATR)
- Tryb ceny: High/Low • Close • Mediana (HL2) • Typowa (HLC3) • Ważona (HLCC4)
- Potwierdzenie fraktalne: konfigurowalne lewe/prawe świece
- Backstep: minimalna liczba świec między kolejnymi pivotami
- Segmenty linii trendu: kolorowane Wzrost/Spadek, konfigurowalna grubość i maksymalna liczba
- Etykiety pivotów: czyste H/L + sformatowana cena
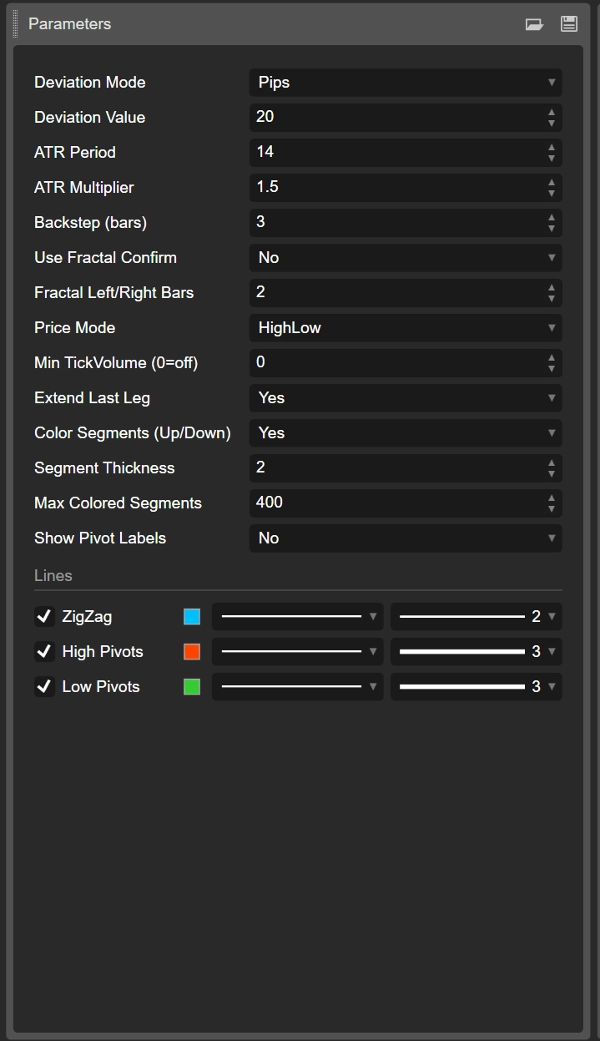
Kluczowe parametry (szybkie odniesienie)
- Tryb odchylenia, wartość odchylenia → próg odwrócenia
- Okres ATR, mnożnik ATR → używane tylko w trybie ATR
- Tryb ceny → źródło ceny do obliczeń
- Backstep (świece) → filtruje drobne wahnięcia
- Użyj potwierdzenia fraktalnego, lewe/prawe świece fraktalne → potwierdzenie pivotu
- Min TickVolume (0=wyłączony) → filtruje świece o niskiej aktywności
- Kolor segmentów, grubość segmentu, maksymalna liczba kolorowych segmentów → wizualizacje i wydajność
- Rozszerz ostatnią nogę, pokaż etykiety pivotów → czytelność w czasie rzeczywistym
Jak używać
- Automatyzuj → Wskaźniki → Nowy: wklej i skompiluj kod Pro.
- Zastosuj na swoim wykresie. Zacznij od Procent = 1–2% lub ATR = 1.0–1.5×.
- Na rynkach o dużym szumie zwiększ Backstep i/lub włącz Potwierdzenie fraktalne.
- Jeśli wykres jest zbyt zatłoczony, zmniejsz Maksymalną liczbę kolorowych segmentów lub wyłącz etykiety.
Wskazówki handlowe
- Dla symboli o wysokiej zmienności preferuj ATR; dla głównych par walutowych często intuicyjne są Pipsy.
- Używaj sekwencji pivotów (HH/HL/LH/LL) do potwierdzania trendu lub zmian biasu.
- Zarządzanie ryzykiem: ustaw stopy poniżej/powyżej ostatniego potwierdzonego pivotu; opcjonalnie podążaj za nimi, gdy potwierdzają się nowe pivoty.
Wydajność i kompatybilność
- Używa nowoczesnych API (
Bars.*,LineColor) oraz wbudowanego AverageTrueRange. - Działa na dowolnym symbolu i interwale czasowym. Obiekty graficzne są ograniczone przez Maksymalną liczbę kolorowych segmentów dla wydajności.
Ocena podsumowująca
★★★★★ 4.8/5 — Silna równowaga między przejrzystością wizualną a zaawansowanymi kontrolkami. Tryb ATR i Potwierdzenie fraktalne pomagają tłumić fałszywe pivoty podczas burzliwych faz.
Podsumowanie
Opinie klientów
5 | 0 % | |
4 | 100 % | |
3 | 0 % | |
2 | 0 % | |
1 | 0 % |


