
Descrição
⚡ Principais Características
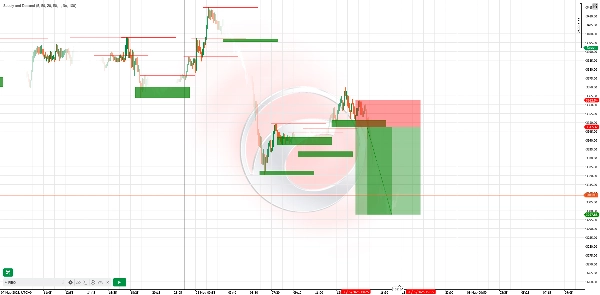
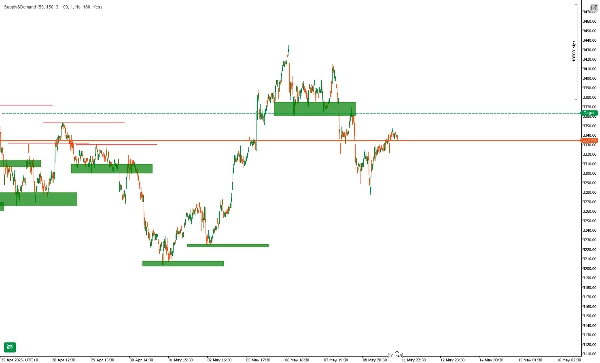
- Detecção Dinâmica de Zonas
-
- Detecta automaticamente os altos/baixos de oscilação e desenha zonas de oferta (resistência) e demanda (suporte) em tempo real.
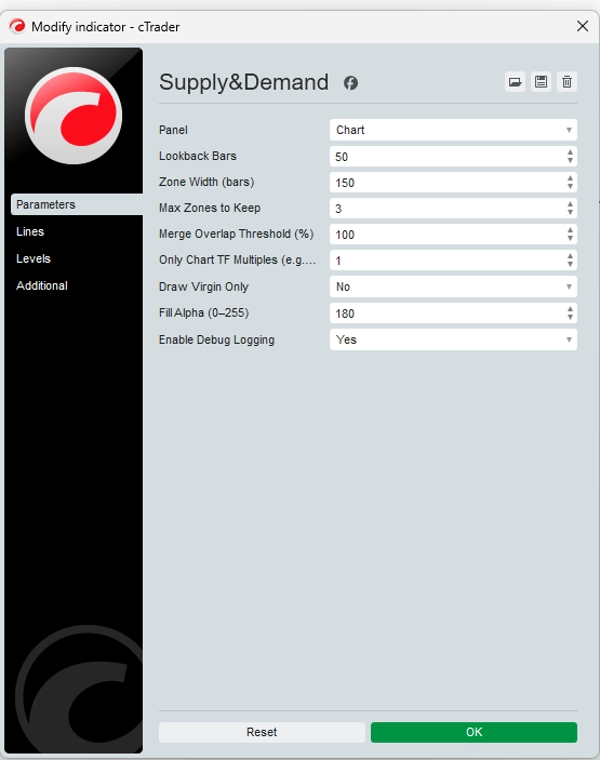
- Parâmetros configuráveis de lookback e largura da zona permitem adaptar a sensibilidade para qualquer mercado ou período.
- Destaque de Zona Virgem
-
- Zonas “virgens” frescas (nunca tocadas pelo preço) são visualmente enfatizadas—negocie onde as instituições deixaram ordens.
- Opcionalmente, oculte zonas tocadas para manter seu gráfico limpo.
- Filtragem Multi-Temporal
-
- Exiba apenas zonas que se alinham com o múltiplo do período do seu gráfico (ex.: mostrar zonas diárias no seu gráfico de 1 hora).
- Veja rapidamente a confluência da oferta/demanda de períodos maiores com sua configuração intradiária.
- Não Repaint e Sem Atraso
-
- Zonas são fixas uma vez desenhadas—sem linhas desaparecendo ou deslocando após o movimento do preço.
- Confiabilidade testada: zonas permanecem estáticas, dando confiança na análise histórica.
- Alertas Personalizados e Registro
-
- Receba alertas pop-up ou por email quando o preço entrar ou romper uma zona.
- Registro detalhado de depuração mostra criação de zonas, sobreposições ignoradas e toques nas zonas.
🚀 Como Funciona
- Detecção de Pivôs: O indicador escaneia cada novo candle para altos pivôs (oferta) e baixos pivôs (demanda) com base no lookback escolhido.
- Construção de Zona: Para cada pivô, uma zona retangular é desenhada para frente—destacando onde as instituições provavelmente colocaram ordens limitadas.
- Filtragem de Sobreposição: Zonas que se sobrepõem além do seu limite se fundem ou são ignoradas, garantindo que apenas as áreas mais significativas permaneçam.
- Opção Apenas Virgem: Mantenha visíveis apenas as zonas intocadas para focar nos níveis institucionais mais recentes.
🎯 Exemplos de Estratégias de Negociação
EstratégiaPeríodoEntradaStop‑LossTake‑Profit
Rejeição de Zona
H1
Espere o preço subir para uma zona de demanda e mostrar um candle de baixa (engolfo/pin bar) na zona de oferta
Logo além do limite da zona
1,5× altura da zona
Confluência de Períodos
M15 + H4
Identifique a zona de demanda H4, depois mude para M15 para candle de momentum de alta dentro dessa zona
Abaixo do mínimo da zona H4
Próximo alto de oscilação H4
Romper e Retestar
H4
Após o preço romper uma zona de oferta, espere o reteste da parte inferior da zona e confirmação de baixa
Acima do topo da zona
Mínimo recente H4
Dica de Uso: Combine com divergência RSI ou MACD dentro das zonas para sinais de maior probabilidade.
📈 Exemplo do Mundo Real
- No EURUSD H4, o indicador desenha uma zona de demanda em 1.0950–1.0980.
- O preço cai para a zona, imprime um candle engolfo de alta M15.
- Entrada em 1.0970, stop em 1.0945 (abaixo da zona), alvo em 1.1040 (próxima resistência H4).
- Resultado: +70 pips (~6,4× risco).
⚠️ Aviso Legal
Este indicador é uma ferramenta—não um sistema garantido de lucro. Desempenho passado não garante resultados futuros. Sempre use gerenciamento de risco adequado (ex.: máximo 2% por operação), teste em conta demo primeiro e combine com sua própria análise. Negociar envolve risco de perda; negocie apenas com capital que pode perder.
Resumo
It supports multi-timeframe filtering, allowing users to display zones aligned with higher timeframe multiples on lower timeframe charts, facilitating confluence analysis. Zones are non-repainting and non-lagging; once drawn, they remain fixed, ensuring reliable historical analysis. Custom alerts notify users when price enters or breaks these zones, and detailed logs track zone creation and interactions.
The indicator operates by scanning each new bar for pivot highs and lows, constructing rectangular zones extending forward, and filtering overlapping zones to retain the most significant areas. It offers a “virgin-only” mode to focus on fresh institutional levels.
Example strategies include zone rejection, multi-timeframe confluence, and break & retest setups, often combined with RSI or MACD divergence for higher-probability signals. A real-world example on EURUSD H4 demonstrates entry, stop-loss, and take-profit placement based on demand zones and candlestick confirmation.
Avaliações de clientes
5 | 75 % | |
4 | 25 % | |
3 | 0 % | |
2 | 0 % | |
1 | 0 % |


