
Deskripsi
ICT Killzones Lengkap – Analisis Sesi Perdagangan Profesional
Kuasi waktu perdagangan institusional dengan indikator ICT Killzones paling lengkap untuk cTrader. Alat tingkat profesional ini secara otomatis mengidentifikasi dan memvisualisasikan semua lima sesi perdagangan ICT (Inner Circle Trader) yang penting, memberi Anda keunggulan untuk berdagang bersama smart money.
Apa yang Baru di Versi Ini:
- Semua 5 Sesi ICT: Cakupan lengkap termasuk Asian Range, London Kill Zone, New York Kill Zone, NY Lunch/Reversal Zone, dan NY PM Kill Zone
- Sistem Warna Pintar: Nama warna sederhana (Merah, Biru, Oranye) menggantikan kode ARGB yang kompleks
- Kontrol Transparansi Independen: Sesuaikan opasitas untuk setiap sesi (0-100%)
- Warna Label Khusus Sesi: Sesuaikan warna label secara terpisah dari warna zona
- Deskripsi Sesi: Label info opsional yang menjelaskan karakteristik setiap sesi
- Performa yang Ditingkatkan: Kode yang dioptimalkan dengan pembersihan otomatis zona lama
Fitur Utama:
📊 Cakupan Sesi Lengkap:
- Asian Range (19:00-00:00 NY): Mengidentifikasi zona konsolidasi dan kumpulan likuiditas untuk serangan berikutnya
- London Kill Zone (02:00-05:00 NY): Menandai lonjakan volatilitas utama yang ideal untuk perburuan stop dan pembalikan
- NY Kill Zone (07:00-10:00 NY): Menyoroti pergerakan besar kedua dengan momentum kuat
- NY Lunch Zone (12:00-13:30 NY): Menampilkan periode pembalikan dan konsolidasi
- NY PM Kill Zone (13:30-16:00 NY): Menangkap pergerakan sekunder dan penyeimbangan pasar
🎨 Kustomisasi Warna Mudah:
- Nama warna sederhana: cukup ketik "Biru", "Oranye", "Ungu", dll.
- 50+ warna yang telah ditentukan termasuk DodgerBlue, BlueViolet, MediumAquamarine
- Dukungan warna heksadesimal (#RRGGBB format)
- Slider transparansi individual (0-100%) untuk setiap zona
- Warna label terpisah untuk kejelasan maksimum
⚙️ Opsi Tampilan yang Kuat:
- Nyalakan/matikan sesi individual
- Tampilkan/sembunyikan label informasi sesi
- Ukuran font yang dapat disesuaikan (6-20)
- Perpanjang zona ke tepi grafik atau tetap terkandung
- Kontrol berapa hari riwayat yang ditampilkan (1-30 hari)
- Pembersihan otomatis mencegah kekacauan grafik
🎯 Desain Profesional:
- Visualisasi bersih dan tidak mengganggu
- Pelacakan tinggi/rendah dinamis selama sesi aktif
- Penanganan sesi semalam yang tepat
- Bekerja pada semua kerangka waktu
- Tanpa lag, performa optimal
Ideal Untuk:
- Trader metodologi ICT yang mencari ketepatan waktu
- Trader smart money yang mengikuti aliran institusional
- Trader harian dan scalper yang membutuhkan batas sesi yang tepat
- Trader swing yang mengidentifikasi zona pembalikan utama
- Siapa saja yang ingin menyelaraskan perdagangan dengan sesi pasar utama
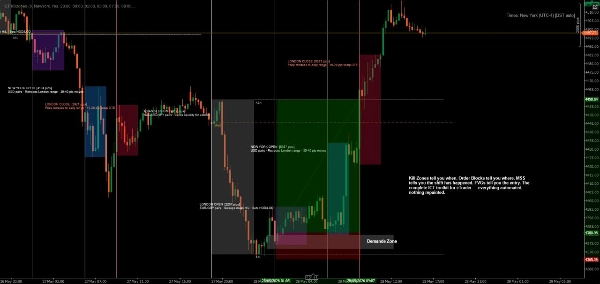
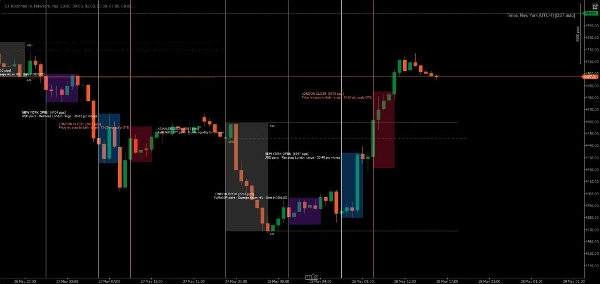
Cara Kerjanya:
Indikator secara otomatis mendeteksi setiap hari perdagangan dan membuat zona berwarna untuk semua lima sesi ICT. Saat harga bergerak melalui setiap sesi, indikator melacak tinggi dan rendah, kemudian menggambar zona akhir saat sesi ditutup. Label dengan jelas mengidentifikasi setiap sesi dan secara opsional menampilkan karakteristik perdagangannya.
Semua waktu menggunakan waktu New York (Eastern), mengikuti metodologi ICT standar.
Contoh Kustomisasi:
- Pengaturan Konservatif: Transparansi rendah (20-30%), warna halus, tanpa info sesi
- Pengaturan Berani: Transparansi tinggi (70-80%), warna cerah, deskripsi sesi lengkap
- Pengaturan Minimal: Matikan sesi yang tidak diinginkan, hanya pertahankan killzones favorit Anda
- Strategi Berkode Warna: Cocokkan warna zona dengan bias perdagangan Anda (hijau = long, merah = short)
Persyaratan Sistem:
- Platform: cTrader Desktop (produk cTrader Store tidak didukung di versi Web atau Mobile) blog.ctrader.com
- Sistem Operasi: Windows 7 atau lebih tinggi
- Prosesor: CPU dual-core direkomendasikan
- Memori: Minimal 2 GB RAM (4 GB direkomendasikan)
- Koneksi Internet: 50 kB per detik atau lebih cepat
Instruksi Instalasi:
- Beli/Instal: Dapatkan indikator dari cTrader Store
- Unduh cTrader Desktop: Jika belum terpasang, unduh dari ctrader.com
- Masuk: Buka cTrader Desktop dan masuk dengan ID cTrader Anda
- Akses Indikator: Navigasi ke bagian "Algo" → daftar "Indicators"
- Tambahkan ke Grafik: Klik kanan pada grafik mana saja → "Indicators" → Pilih "ICT Killzones Complete"
- Sesuaikan: Klik kanan nama indikator di grafik → "Settings" untuk mengatur warna, waktu, dan opsi tampilan
Tips untuk Hasil Terbaik:
- Gunakan pada kerangka waktu 1 menit hingga 1 jam untuk visibilitas optimal
- Gabungkan dengan aksi harga dan konsep likuiditas untuk hasil terbaik
- Sesuaikan waktu sesi jika broker Anda menggunakan zona waktu berbeda
- Eksperimen dengan transparansi untuk menemukan keseimbangan visual yang sempurna
- Aktifkan label info sesi saat belajar, nonaktifkan untuk grafik yang lebih bersih
Perdagangkan dengan presisi. Perdagangkan dengan percaya diri. Perdagangkan dengan cara ICT.
Catatan: Indikator ini untuk tujuan edukasi dan informasi. Kinerja masa lalu tidak menjamin hasil di masa depan. Selalu praktikkan manajemen risiko yang tepat.
Ringkasan
The indicator tracks high and low prices during active sessions and finalizes zones upon session close, providing clear visual boundaries for institutional trading timing. It supports all timeframes, handles overnight sessions properly, and includes automatic cleanup of old zones to maintain chart clarity. Customization options include font size adjustment, zone extension control, and history length for displayed zones. ICT Killzones Complete is suitable for traders using ICT methodology, smart money concepts, scalping, day trading, and swing trading across markets such as Forex, commodities, and crypto. It requires cTrader Desktop on Windows 7 or higher with recommended hardware specifications.
Ulasan pelanggan
5 | 50 % | |
4 | 25 % | |
3 | 0 % | |
2 | 25 % | |
1 | 0 % |


