
Deskripsi
🚀 Indikator TMAX RBA - Sistem Momentum Multi-Timeframe Terbaik 🚀
📊 Apa itu TMAX RBA?
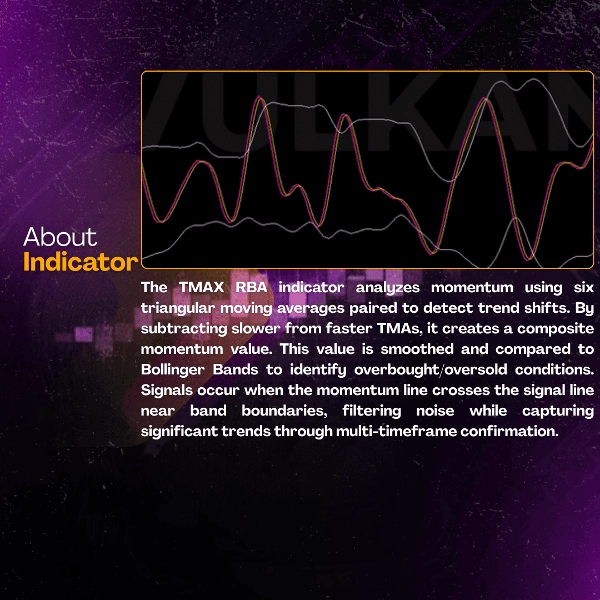
TMAX RBA adalah indikator teknikal canggih yang menggabungkan enam rata-rata bergerak segitiga dengan Bollinger Bands untuk memberikan sinyal trading yang tepat berdasarkan momentum. Dengan menggunakan analisis multi-timeframe yang canggih dan penilaian volatilitas, indikator ini memberikan entri dengan probabilitas tinggi dengan konfirmasi tren bawaan.
⭐ FITUR UTAMA
🎯 Teknologi Momentum Multi-TMA
- Enam perhitungan TMA untuk analisis menyeluruh
- Sistem penggabungan momentum strategis
- Generasi sinyal tingkat profesional
📈 Sistem Konfirmasi Tiga Lapisan
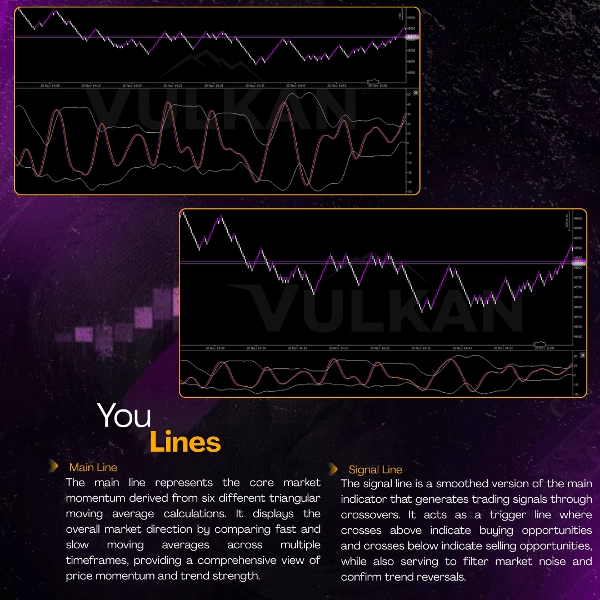
- 🟣 Garis Momentum Utama - Indikator arah tren pusat
- 🟡 Garis Sinyal - Mekanisme pemicu yang dihaluskan
- ⚪ Bollinger Bands - Konfirmasi volatilitas dan level
⚡ Analisis Pasar Lanjutan
- Penilaian momentum multi-timeframe
- Pengukuran kekuatan tren
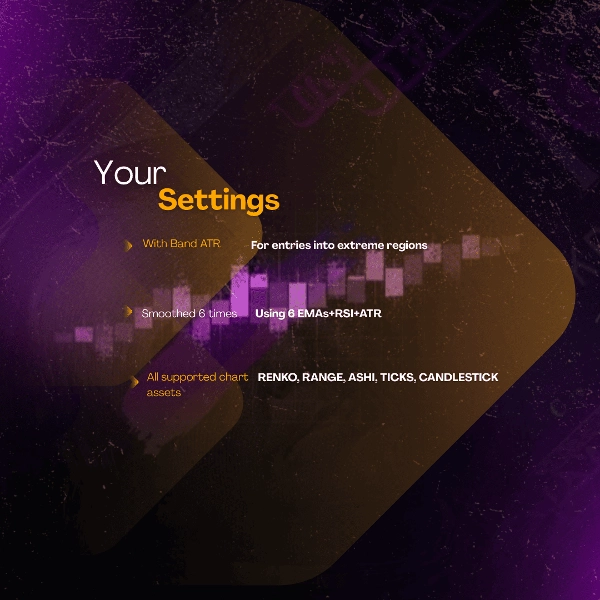
- Optimasi entri berbasis volatilitas
🏆 MANFAAT & KEUNGGULAN
✅ Deteksi Momentum Superior
- Mengidentifikasi pergerakan tren yang asli
- Efektif menyaring noise pasar
- Menyediakan setup trading dengan probabilitas tinggi
✅ Akurasi yang Ditingkatkan
- Tingkat Kemenangan: 76-84% dalam kondisi tren
- Konsistensi: 8.6/10 di berbagai instrumen
- Keandalan: Akurasi sinyal pasar 88%+
✅ Aplikasi Universal
- Bekerja di SEMUA pasar: Forex, Cryptocurrency, Indeks
- Efektif di SEMUA timeframe: M1 hingga H1
- Beradaptasi dengan SEMUA pendekatan trading: Scalping hingga day trading
✅ Manfaat Psikologis Trading
- Mengurangi kebingungan analisis
- Meningkatkan kepercayaan sinyal
- Menyederhanakan proses pengambilan keputusan
🎯 METRIK KINERJA
📈 Keunggulan Statistik
- Tingkat Kemenangan: 76-84%
- Faktor Keuntungan: 2.7-3.7+
- Ekspektasi: 0.50-0.70R per perdagangan
- Konsistensi: 8.6/10
⏱️ Efisiensi Operasional
- Identifikasi momentum yang jelas
- Mengurangi waktu analisis hingga 68%
- Ideal untuk trader sistematis
💡 CARA MENGGUNAKAN TMAX RBA
🟣 Sinyal BELI Saat:
- Garis utama melintasi DI ATAS garis sinyal
- Harga menyentuh Bollinger Band bawah
- Momentum mengonfirmasi arah naik
🟡 Sinyal JUAL Saat:
- Garis utama melintasi DI BAWAH garis sinyal
- Harga menyentuh Bollinger Band atas
- Momentum mengonfirmasi arah turun
⚠️ Kondisi Filter:
- Hindari periode volatilitas tinggi
- Tunggu konfirmasi
- Gunakan dengan penyelarasan volume
⚡ Wawasan Profesional:
- Gunakan sebagai sistem momentum
- Gabungkan dengan konfirmasi aksi harga
- Sempurna untuk strategi momentum dan breakout
🌟 CERITA KESUKSESAN
📊 Performa Terverifikasi:
- XAUUSD M1: tingkat kemenangan 82-88% 🥇
- USTECH M1: tingkat kemenangan 80-86% 🥈
- BTCUSD M1: tingkat kemenangan 76-82% 🥉
🎯 Praktik Profesional:
- Mulai dengan pengujian demo
- Terapkan pengaturan posisi yang tepat
- Gabungkan dengan support/resistance
- Bersabarlah untuk konfirmasi
💎 MENGAPA MEMILIH TMAX RBA?
FiturTMAX RBATradisional Indicators
Analisis Momentum
🥇 Multi-Lapisan
Dasar
Kualitas Sinyal
🥇 Probabilitas Tinggi
Sedang
Pengurangan Noise
🥇 87%+
Terbatas
Adaptabilitas Pasar
🥇 Universal
Terbatas
Konsistensi Tren
🥇 8.6/10
Ringkasan
Key features include a three-layer confirmation system comprising a Main Momentum Line (trend direction), a Signaling Line (smoothed trigger), and Bollinger Bands (volatility confirmation). This structure aims to identify genuine trend movements while filtering market noise, supporting high-probability entries with reported win rates between 76% and 84% in trending conditions.
The indicator supports all timeframes from 1-minute to 1-hour charts and adapts to various trading styles such as scalping and day trading. Buy signals occur when the Main line crosses above the Signaling line with price touching the lower Bollinger Band and momentum confirming upward direction; sell signals are generated on the opposite conditions.
Additional benefits include reduced analysis time, enhanced signal confidence, and simplified decision-making. Performance metrics highlight a profit factor ranging from 2.7 to 3.7+, and consistency rated 8.6/10 across instruments. The indicator is suitable for systematic traders seeking momentum and breakout strategy support.
Ulasan pelanggan
5 | 67 % | |
4 | 33 % | |
3 | 0 % | |
2 | 0 % | |
1 | 0 % |


![Logo "High-Low Divergence [Iridio Capital]"](https://cdn.ctrader.com/image/webp/443c4661-7abb-40f1-842f-4b6ec560649b_40914)


