

Descripción
PERFIL DE VOLUMEN SWING (SVP)
Perfil de volumen basado en swing + Fibonacci + RSI
--------------------------------------------------
Detección de swings. Perfil de volumen. Fibonacci. RSI. Todo en uno.
--------------------------------------------------
LO QUE HACE ESTE INDICADOR
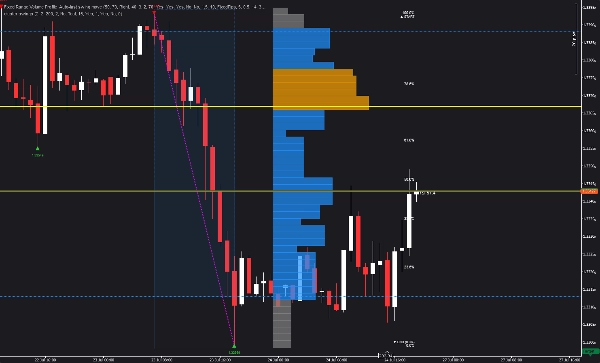
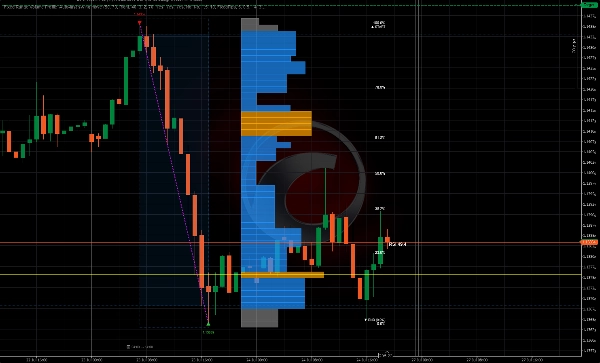
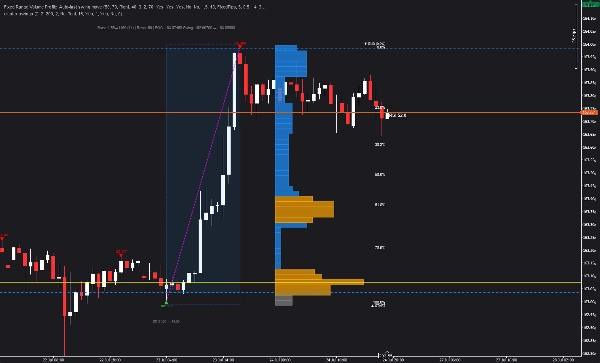
El Perfil de Volumen Swing (SVP) detecta automáticamente los swings estructurales y muestra un perfil de volumen para el swing completado más reciente, con retroceso de Fibonacci y superposición de RSI.
No se necesita selección manual del rango. El indicador encuentra los swings y construye el perfil automáticamente.
--------------------------------------------------
CARACTERÍSTICAS PRINCIPALES
- DETECCIÓN AUTOMÁTICA DE SWING (profundidad y desviación configurables)
- Perfil de Volumen para el último swing completado
- Punto de Control (POC) - nivel de volumen más alto
- Área de Valor (VAH + VAL) - porcentaje configurable
- Nodos de Alto Volumen (HVN) - volumen por encima del umbral promedio
- Retroceso de Fibonacci (0, 23.6, 38.2, 50, 61.8, 78.6, 100)
- Superposición de RSI cerca del precio actual
- Posicionamiento del histograma: Izquierda, Derecha o Cerca de las barras
- Filas configurables (10 a 200)
- Colores y opacidad personalizables
- Extender líneas hacia la derecha
- Mostrar/ocultar etiquetas de precio
- Sin repintado
--------------------------------------------------
CÓMO FUNCIONA
1. El indicador detecta swings usando profundidad y desviación configurables
2. Se identifica el último swing completado
3. Se calcula el perfil de volumen a partir del rango del swing
4. Se muestran POC, VAH, VAL, HVN
5. Se superpone el retroceso de Fibonacci sobre el swing
6. Se muestra el RSI actual cerca del precio
Todo automático. No se requiere entrada manual.
--------------------------------------------------
ELEMENTOS VISUALES
- Triángulos rojos hacia abajo = Máximos de swing
- Triángulos verdes hacia arriba = Mínimos de swing
- Línea punteada magenta = Conexión de swing
- Línea horizontal amarilla = Punto de Control (POC)
- Líneas azules discontinuas = Valor Alto (VAH) y Valor Bajo (VAL)
- Barras naranjas = Nodos de Alto Volumen (HVN)
- Barras grises = Nodos de bajo volumen
- Líneas horizontales doradas = Niveles de Fibonacci
- Etiquetas blancas = Porcentajes de Fibonacci
- Valor RSI = RSI actual cerca del precio
--------------------------------------------------
RESUMEN DE PARÁMETROS
CONFIGURACIÓN DEL PERFIL:
- Número de filas: Cuántas filas de precio (10-200)
- Porcentaje del área de valor: % de volumen en el área de valor (1-100)
CONFIGURACIÓN VISUAL:
- Posición del histograma: Derecha, Izquierda, Cerca de las barras o Cerca de las barras a la izquierda
- Ancho del histograma %: Ancho de las barras del histograma
- Escala del ancho de barra: Factor de escala para el ancho de las barras
- Ancho mínimo de barra %: Ancho mínimo de barra
- Opacidad de barra: Transparencia de las barras (10-100)
DETECCIÓN DE SWING:
- Profundidad del swing: Cuántas barras revisar para extremos locales
- Modo de desviación: Pips fijos o basado en ATR
- Desviación fija: Distancia mínima en pips entre swings
- Multiplicador de desviación ATR: Multiplicador para desviación basada en ATR
- Periodo ATR: Periodo para cálculo de ATR
- Retroceso: Mínimo de barras entre swings
VISUAL - SWINGS:
- Mostrar líneas de swing: Alternar línea de swing magenta
- Color de línea de swing
- Mostrar etiquetas de swing: Alternar etiquetas de precio
- Colores de swing alto/bajo
VISUAL - FIBONACCI:
- Mostrar retroceso Fib: Alternar superposición de Fibonacci
- Mostrar líneas Fib: Alternar líneas horizontales
- Mostrar etiquetas Fib: Alternar etiquetas de porcentaje
- Color de línea Fib / Color de texto Fib
VISUAL - RSI:
- Mostrar valor RSI: Alternar superposición RSI
- Periodo RSI: Periodo para cálculo RSI
- Color de etiqueta RSI
COLORES:
- Color POC / Color área de valor / Color nodo de alto volumen / Color volumen bajo
--------------------------------------------------
CASOS DE USO
- Identificar swings y distribución de volumen en una vista
- Encontrar Punto de Control (POC) para entradas y salidas
- Usar Área de Valor (VAH/VAL) para objetivos de ganancia
- Detectar Nodos de Alto Volumen (HVN) para niveles clave
- Aplicar retroceso de Fibonacci al swing
- Confirmar operaciones con confluencia RSI
- Entender la distribución de volumen de un vistazo
--------------------------------------------------
ACTUALIZACIÓN A ZONAS DE CALOR ESTRUCTURALES
Este indicador te muestra swings y distribución de volumen.
Zonas de Calor Estructurales va más allá: mapea la intensidad de participación, aceptación vs rechazo y compromiso del mercado a través de múltiples zonas.
Busca Zonas de Calor Estructurales en la tienda cTrader.
--------------------------------------------------
ACTUALIZACIÓN A INVICTUS EA
Invictus EA utiliza tecnología estructural para ejecutar operaciones automatizadas.
Busca Invictus en la tienda cTrader.
--------------------------------------------------
NOTAS TÉCNICAS
- Indicador superpuesto
- Funciona en cualquier marco temporal y símbolo
- Sin repintado (cálculo histórico)
- Optimizado para rendimiento
--------------------------------------------------
SOPORTE
Actualizaciones de por vida incluidas.
PARA MÁS INFORMACIÓN - Haz clic en el perfil del desarrollador abajo.
Resumen
The indicator identifies swings using configurable parameters such as swing depth and deviation mode (fixed pips or ATR-based), then computes volume distribution within the swing range without requiring manual range selection. Visual elements include colored markers for swing highs and lows, volume nodes, Fibonacci levels, and RSI values, all customizable in terms of color, opacity, and histogram positioning.
Key features include no repainting, configurable rows for volume profile resolution, extendable lines, and toggleable price labels. Use cases focus on identifying swing structures, volume distribution, key price levels, and confluences for trade entries, exits, and profit targets. The indicator is optimized for performance and provides lifetime updates.





























