

present
Sign up and get $50 off your first purchase
Trading product for Fixed Range Volume profile Indicator Key Levels Imbalance, image 1
Fixed Range Volume profile
Indicator
1 purchases
Version 1.0, Jul 2026
Windows, Mac
Trading product for Fixed Range Volume profile Indicator Key Levels Imbalance, image 2
Trading product for Fixed Range Volume profile Indicator Key Levels Imbalance, image 3
Trading product for Fixed Range Volume profile Indicator Key Levels Imbalance, image 4
Since 14/01/2025
2
Sales
143
Free installs

Description

FIXED RANGE VOLUME PROFILE (FRVP)

Auto-Detecting Volume Profile Indicator


--------------------------------------------------


Volume distribution. Value areas. High-volume nodes. All from your trendline.


--------------------------------------------------


WHAT THIS INDICATOR DOES


Fixed Range Volume Profile (FRVP) displays volume distribution over a user-defined range — automatically detecting the latest trendline you draw on the chart.


No manual range selection needed. Just draw a trendline and the profile appears.


--------------------------------------------------


KEY FEATURES


- AUTO-DETECTS latest trendline (no manual naming required)

- Point of Control (POC) - highest volume level

- Value Area (VAH + VAL) - configurable percentage (default 70%)

- High Volume Nodes (HVN) - volume above average threshold

- Histogram display (left or right side of range)

- Configurable rows (10 to 200)

- Customizable colors and opacity

- Extend lines to the right

- Show/hide price labels

- No repainting


--------------------------------------------------


HOW IT WORKS


1. Draw a trendline on the chart

2. The indicator automatically detects it

3. Volume profile is calculated from the range

4. POC, VAH, VAL, and HVN are displayed


No naming required. No manual range selection.


--------------------------------------------------


VISUAL ELEMENTS


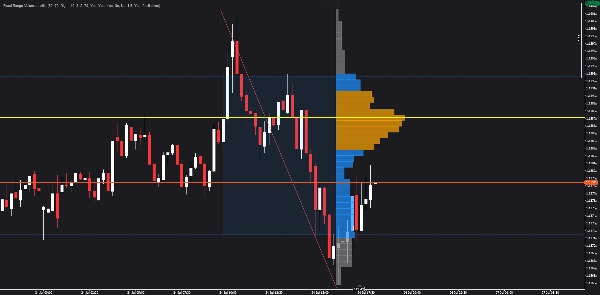
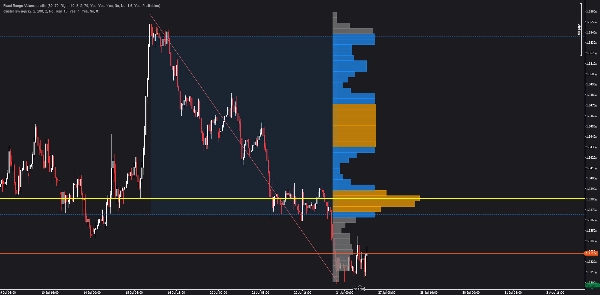
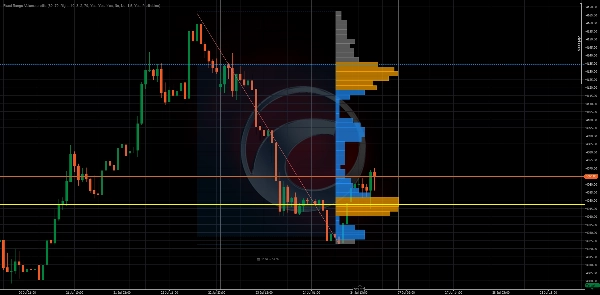
- Yellow horizontal line = Point of Control (POC)

- Blue dashed lines = Value Area High (VAH) and Value Area Low (VAL)

- Orange bars = High Volume Nodes (HVN)

- Gray bars = Low volume nodes

- Shaded region = Value Area (70% of volume)

- Histogram = Volume distribution by price level


--------------------------------------------------


PARAMETER OVERVIEW


PROFILE SETTINGS:

- Number of Rows: How many price rows (10-200)

- Value Area Percentage: % of volume in value area (1-100)


VISUAL SETTINGS:

- Profile Side: Left or Right of range

- Histogram Width %: Width of histogram bars

- Bar Width Scaling: Scaling factor for bar widths

- Min Bar Width %: Minimum bar width

- Bar Opacity: Transparency of bars (10-100)


COLORS:

- POC Color

- Value Area Color

- High Volume Node Color

- Low Volume Color


HIGH VOLUME NODES:

- HVN Threshold: Volume multiplier to qualify as HVN


TRENDLINE SETTINGS:

- Auto-Detect Latest: Automatically find latest trendline

- Manual Trendline Name: Specify a name (if auto-detection off)


--------------------------------------------------


USE CASES


- Identify where most volume occurred

- Find Point of Control (POC) for entries/exits

- Use Value Area (VAH/VAL) for profit targets

- Spot High Volume Nodes (HVN) for key levels

- Understand volume distribution at a glance

- Combine with other indicators for confluence


--------------------------------------------------


UPGRADE TO STRUCTURAL HEAT ZONES


This indicator shows you volume distribution.


Structural Heat Zones takes it further — it maps participation intensity, acceptance vs rejection, and market engagement across multiple zones.


Search for Structural Heat Zones in the cTrader Store.


--------------------------------------------------


UPGRADE TO INVICTUS EA


Invictus EA uses structural technology to execute automated trades.


Search for Invictus in the cTrader Store.


--------------------------------------------------


TECHNICAL NOTES


- Overlay indicator

- Works on any timeframe and symbol

- No repainting (historical calculation)

- Optimized for performance


--------------------------------------------------


SUPPORT


Lifetime updates included.


FOR MORE INFORMATION - Click Developer's Profile below.

Summary

AI summary
Fixed Range Volume Profile (FRVP) is a volume profile indicator designed for trading charts that automatically detects the latest trendline drawn by the user. It calculates and displays volume distribution within the fixed range defined by this trendline, eliminating the need for manual range selection. Key features include visualization of the Point of Control (POC) representing the highest volume price level, Value Area High (VAH) and Value Area Low (VAL) defining a configurable percentage (default 70%) of total volume, and High Volume Nodes (HVN) indicating volume above an average threshold. The indicator presents these elements as a histogram on either side of the range, with customizable rows, colors, opacity, and the option to extend lines to the right. Visual elements include yellow horizontal lines for POC, blue dashed lines for VAH and VAL, orange bars for HVN, and shaded regions for the value area. FRVP works on any timeframe and symbol without repainting, providing a stable overlay for volume analysis. Typical use cases involve identifying key volume levels for entries, exits, and profit targets, as well as understanding volume distribution and combining with other indicators for confluence. The indicator supports extensive visual and profile parameter customization to suit individual trading preferences.
Indicator profile
Indicator category
Volume
Output type
Visualisation
Data requirements
Bars only
Tick data
Volume
Supported signals
Trend strength
Volatility
Reversal
Breakout
Session opening range
Level touch
Level break
Cross

Customer reviews

0.0
Reviews: 0
Customer reviews
No reviews for this product yet. Already tried it? Be the first to tell others!

Discussion

FAQ

Key Levels
Imbalance
Volume
Products available through cTrader Store, including trading bots, indicators and plugins, are provided by third-party developers and made available for informational and technical access purposes only. cTrader Store is not a broker and does not provide investment advice, personal recommendations or any guarantee of future performance.

More from this author

Indicator
ATR
RSI
+5
Free swing detector with Fibonacci retracement and RSI overlay. Auto-deviation adapts to any timeframe
cBot
ATR
Wedge
+5
15 YEARS RESULTS :Win rate:93% | ROI+19000% | Trades:87,000 | Profit Factor 1.2 | Currency Pairs:22 | $10k to 500k$ |
1.2
Profit factor
Indicator
ATR
BOS
+5
Heat intensity mapping of structural participation. See where price fights, where it accepts, and where it rejects .
Indicator
RSI
Volume
+3
Auto-detects swings, Includes POC, Value Area (VAH/VAL), High Volume Nodes (HVN), Fibonacci retracement, and RSI overlay

You may also like

Indicator
Forex
cTrader ZigZag Alerts: Precision Swing Detection, Alerts, and Fibonacci.
Indicator
SMC
Prop
+9
PDL/PDH/PWL/PWH and Session higs/lows (customizable)
Indicator
ATR
Key Levels
+5
CPR indicator that actually predicts the day ahead: width percentile scoring for breakout-day detection
Indicator
ATR
Prop
+13
Enhance trading with ATR Bands! Visualize market volatility using dynamic upper and lower ATR bands for precise decision
Indicator
SMC
Forex
+7
Simple Smart Money Concepts (SMC)
Indicator
Prop
Forex
+11
🌊 See when the market is truly in play. Tsunami measures Relative Volume by time-of-day 🌊
Indicator
Volume
Channel
+5
Spots volatility squeezes before they fire — the compression phase everyone else misses.
Indicator
Volume
Key Levels
+5
Volume Profile Pro - A Lightweight and Highly Customizable Volume Profile
Indicator
AI
Grid
+9
Pivot Point MultiTimeFrame with Order Block
Indicator
MultiTF Pivot and SR Indicator
Indicator
Pin Bar
Inducement
+5
Institutional Nasdaq Session Liquidity Map with Live Point HUD, Sweep Alerts & Interactive Playbook.
Indicator
BOS
CHOCH
+5
MyZTrade High TF candle is a multi-timeframe visualisation tool that overlays completed higher-timeframe candles.
Indicator
Forex
BTCUSD
+4
This indicator is designed to perform multiple non-linear regression analysis using four independent variables.
Indicator
AI
ATR
+27
Smart Money Gaps: MTF FVG auto-detection, extension, and mitigation marker. Trade institutional imbalances.
Indicator
BOS
Fibonacci
+4
Automatically draws major trading sessions, killzones, and SMC daily liquidity targets directly on your cTrader charts.
Indicator
This indicator can be used to: change color, shape size, position, change font, increase or decrease, and other function
Indicator
ATR
EMA
+5
The indicator displays potential reversal zones (support/resistance) on the chart based on the average range (High–Low)
Indicator
VWAP
Forex
+13
Custom VWAP Indicator for cTrader

Price

Since 14/01/2025
2
Sales
143
Free installs




























