
JMA-Like
Indicator
1 purchases
Version 1.0, Aug 2025
Windows, Mac
5.0
Reviews: 1
Description
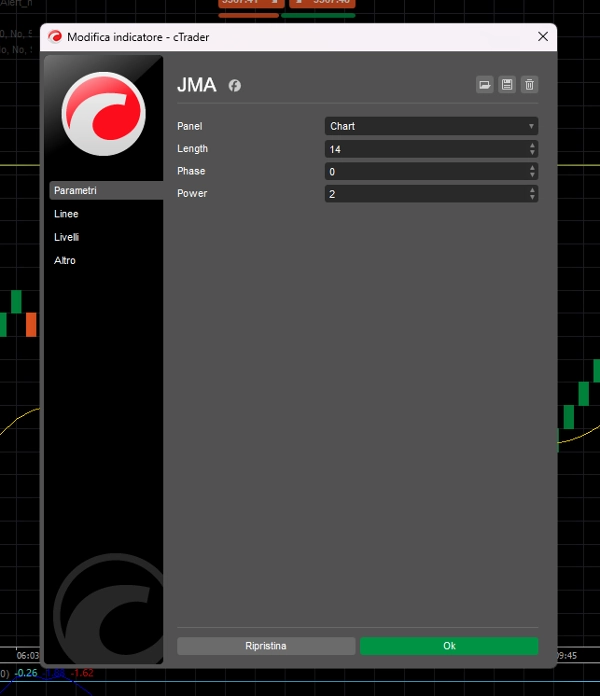
JMA-Like – Adaptive Zero-Lag Moving Average
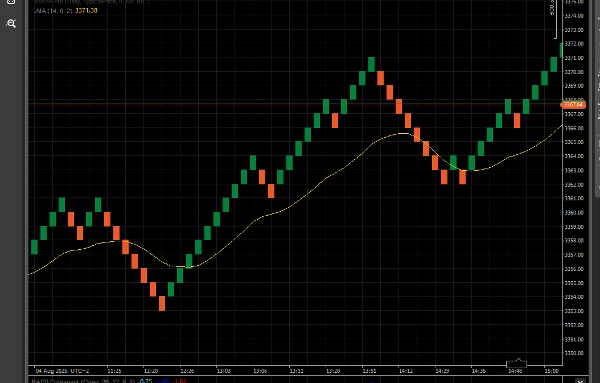
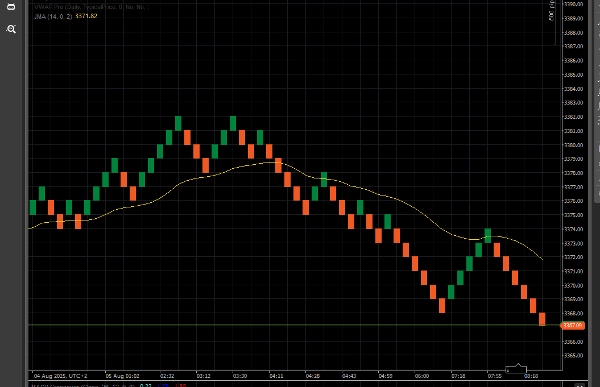
JMA Advanced is a highly responsive and ultra-smooth moving average designed to replicate the behavior of the original Jurik Moving Average (JMA). It dynamically adapts to market volatility, reducing lag while filtering out noise.
Built with advanced smoothing algorithms, JMA Advanced is perfect for both trend-following and contrarian strategies. It includes adjustable Phase and Power parameters to control responsiveness and overshoot, making it ideal for Renko, range, and price action traders.
✅ Zero-lag feel
✅ Volatility-adaptive
✅ Works on all timeframes and chart types
✅ Fully customizable
Summary
AI summary
JMA-Like is an adaptive zero-lag moving average indicator designed to replicate the behavior of the original Jurik Moving Average (JMA). It features advanced smoothing algorithms that dynamically adjust to market volatility, reducing lag while filtering out noise. The indicator includes customizable Phase and Power parameters, allowing users to control responsiveness and overshoot. It is suitable for various trading styles, including trend-following and contrarian strategies, and works effectively on all timeframes and chart types such as Renko, range, and price action charts. Key features include a zero-lag feel, volatility adaptation, and full customization options.
Indicator profile
Customer reviews
5.0
Reviews: 1
5 | 100 % | |
4 | 0 % | |
3 | 0 % | |
2 | 0 % | |
1 | 0 % |
Customer reviews
Discussion
FAQ
Products available through cTrader Store, including trading bots, indicators and plugins, are provided by third-party developers and made available for informational and technical access purposes only. cTrader Store is not a broker and does not provide investment advice, personal recommendations or any guarantee of future performance.
More from this author


!["[Hamster-Coder] Moving Average MTF" logo](https://cdn.ctrader.com/image/webp/b11b98b1-194d-4b8e-b00e-d611826ad159_31226)


!["[CB] Pivot Points Pro" logo](https://cdn.ctrader.com/image/webp/43463c82-67b0-4f10-a4ba-901bba091d81_32594)


!["[Stellar Strategies] MARSI Signal Plotter" logo](https://cdn.ctrader.com/image/webp/7b2b8da6-8f8e-4646-8d4a-4710c516c01e_25567)


Price
Since 16/07/2025
5
Sales