present
Sign up and get $50 off your first purchase
Trading product for CVD Indicator Signal, image 1
CVD
Indicator
3 purchases
Version 1.0, Dec 2025
Windows, Mac
Reviews: 3
Trading product for CVD Indicator Signal, image 2
Since 29/06/2025
2
Sales
13
Free installs

Description

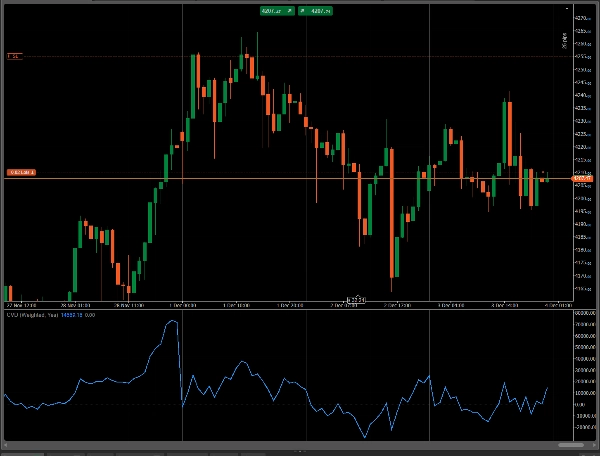
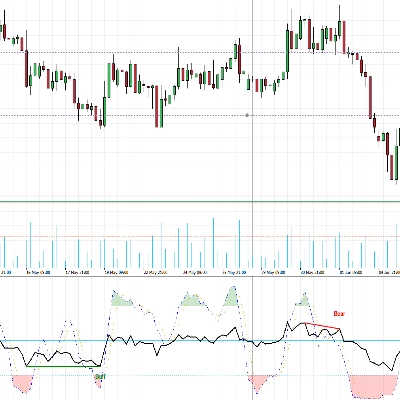
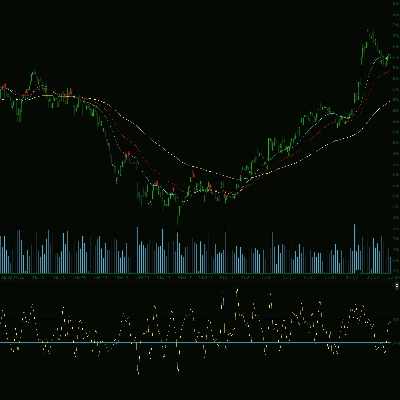
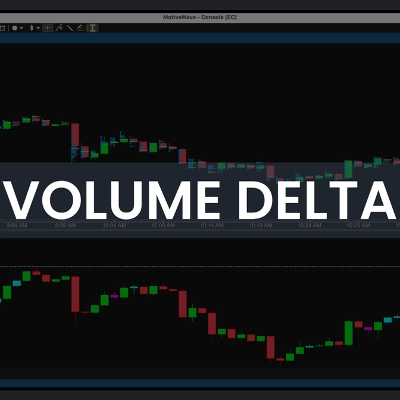
Cumulative Volume Delta is a trading indicator that tracks the net difference between buying and selling pressure over time by accumulating volume data

Summary

AI summary
Cumulative Volume Delta (CVD) is a trading indicator that measures the net difference between buying and selling pressure by accumulating tick volume data over time. It tracks the balance of volume traded at the bid and ask prices to provide insight into market sentiment and potential price movements. This indicator helps traders identify shifts in supply and demand dynamics by highlighting whether buying or selling activity dominates during a given period. CVD is used as a signal tool to support trade entry decisions based on volume analysis.
Indicator profile

Customer reviews

4.6
Reviews: 3
5
67 %
4
33 %
3
0 %
2
0 %
1
0 %
Customer reviews
December 12, 2025
A calm trader gets value from the entry feels calmer, and a week of notes gives a better read.
December 11, 2025
Works better when the trader stays patient. 20 reactions is a fair first sample.
December 7, 2025
The click feels less impulsive, but it should not replace the chart.

Discussion

FAQ

Signal
Products available through cTrader Store, including trading bots, indicators and plugins, are provided by third-party developers and made available for informational and technical access purposes only. cTrader Store is not a broker and does not provide investment advice, personal recommendations or any guarantee of future performance.


You may also like

Indicator
AI
SMC
+9
Identifies market trends (-10 to +10) using HMA with volume confirmation. Includes customizable alerts.
Indicator
AI
ATR
+12
The standard Relative Strength Index (RSI), RSI & Signal Cloud, Smart Volatility Filter (ATR), On-Chart Info Dashboard
Indicator
Color-Based Market Pressure & Volatility Visualizer The Kandika Heatmap Indicator
Indicator
ATR
VWAP
+4
Structure-aware indicator that re-anchors VWAP to confirmed swing pivots.
Indicator
RSI
Stochastic
+2
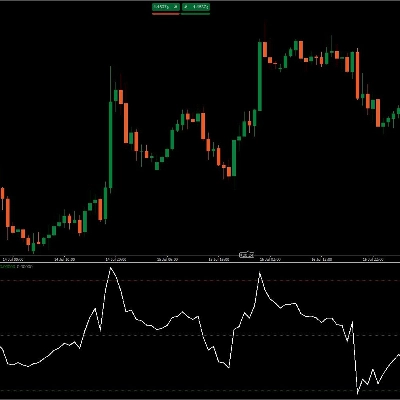
Composite mean-reversion oscillator merging Z-Score, RSI & Bollinger %B into one clear overbought/oversold signal.
Indicator
Volume
Key Levels
+2
Support and resistance from a rolling volume profile, ranked by strength or recency, updated live.
Indicator
EMA
AI-assisted
+1
Multi EMA Timeframes lets you stay on your chart and see the exact EMA from any timeframe you choose — up to 5 at once.
Indicator
Forex
BTCUSD
+4
This indicator is designed to perform multiple non-linear regression analysis using four independent variables.
Indicator
SMC
Prop
+9
PDL/PDH/PWL/PWH and Session higs/lows (customizable)
Indicator
ATR
EMA
+3
The UTBot you know from TradingView — now on cTrader with confirmed signals, VWAP, EMA and session overlays.
Indicator
RSI
Forex
+10
Unlock Stochastic RSI PRO in cTrader! Overlay RSI, highlight zones, and identify divergences with customizable settings.
Indicator
ATR
RSI
+20
SMC/ICT signals using FVG + liquidity sweep/MSS with EMA-RSI-MACD filters, clear visuals, and actionable alerts.
Indicator
AI
SMC
+14
Refined cleaner version of Key Levels indicator with broker UTC offset, styles & label alignment.
Indicator
Indices
Commodities
The Advanced CCI & EMA Indicator combines the CCI with 40 & 80 EMA logic to generate precise arrows signaling direction
Indicator
Channel
Imbalance
+2
Adaptive volatility channel based on moving average and standard deviation (σ).
Indicator
AI
Prop
+7
EMA Clouds, Multi-Timeframe (MTF) Overlay, Swing High/Low detection, and a smart Dashboard with neutral zone filtering.
Indicator
Prop
Forex
+4
Pivot Points Standard — All-in-One Multi-Timeframe Pivot Indicator for cTrader
Indicator
CHOCH
Inducement
+5
TradeLens - Frame the Trade. Refine the Entry. Two Timeframes. One Decision.

Price

Since 29/06/2025
2
Sales
13
Free installs