Dynamic Trend Gradient
Indicator
1 purchases
Version 1.0, Jan 2025
Windows, Mac
"Dynamic Trend Gradient" uploaded image
Since 03/10/2024
140
Sales
29.97K
Free installs

πŸ“ˆ This indicator is a tool that helps us identify and visualize the direction of the trend in a price chart. πŸ“Š Its operation is based on the calculation of trend levels using exponential moving averages and a measure of volatility to determine the zones where the price is expected to move. Below, I’ll explain in detail how it works:

πŸ“ Calculation of Trend Levels

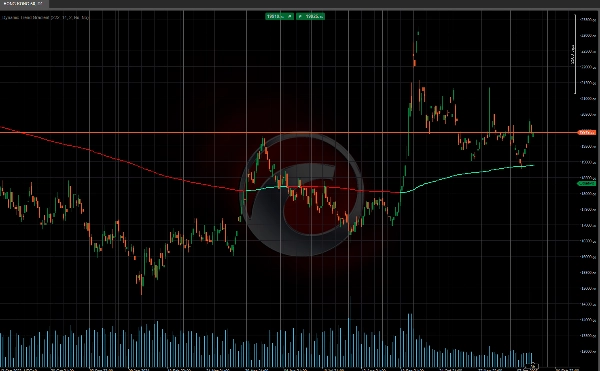
The indicator starts by calculating what is called the "basis level." This level is obtained by averaging two exponential moving averages: one short-term (based on a user-defined length, in this case, 222) and one long-term (double the length of the first). These averages give us a reference for the overall trend.

Next, volatility is calculated using the standard deviation of the closing prices, and this value is smoothed with an additional exponential moving average. The smoothed volatility is multiplied by a parameter called "sensitivity," which gives us the upper and lower levels around the basis level. These levels act as trend bands and help identify whether the price is above or below the trend.

πŸ“‰πŸ“ˆ Trend Status

With these levels calculated, the indicator evaluates the trend status in the market. If the price is above the basis level, it assumes a bullish trend πŸ‚, and if it’s below, the trend is bearish πŸ». If the price crosses the upper or lower levels, the indicator changes its trend signal, indicating a possible reversal or shift in market momentum.

This tool is perfect for traders looking to stay ahead of market trends! πŸš€πŸ“‰πŸ“ˆ


Ctrader Store indicators:


Channel Breakout System

Fair Value Gap Sessions

 BOS & CHOCH

ZigZag

Supertrend

Market Imbalance

Adaptive Trend Channel 

Dynamic Market Structure
Analysis of Turning Points

Order Block

Fibonacci Linear
Regression Multi-timeframe

Volume POC Heatmap

Dynamic RSI

Momentum Fair Value Gap

Market Flow Projection

Dynamic Trend Gradient

Multi-Level Candle Bias
Tracker

Zig-Zag Extremity Tracker

Reactive Moving Average

Auto-Trend Channel

Auto Support and
Resistance Trend Lines

All Support and
Resistance Levels

Leverage Liquidation Map

Zones Supply Demand

Dynamic Range Momentum

0.0
Reviews: 0
Customer reviews
No reviews for this product yet. Already tried it? Be the first to tell others!
RSI
Breakout
Signal
Supertrend

More from this author

Indicator
RSI
XAUUSD
Breakout
+6
ZigZag filters noise, spots trends, patterns, pivots, aiding analysis, trade management, and confirmations. πŸ“‰πŸ“ˆ
Indicator
RSI
XAUUSD
Breakout
+6
Identify bullish and bearish Order Blocks to spot key support/resistance levels and potential trend reversals! πŸ“ˆπŸ”„
Indicator
RSI
Breakout
XAUUSD
+6
πŸ“Š Shows volume by price levels, highlights POC, and key zones. Identifies dynamic support/resistance and imbalances.
Indicator
RSI
XAUUSD
Breakout
+5
Market structural patterns , specifically the concepts of Change of Character (ChoCH) πŸ”„ and Break of Structure (BoS) πŸ’₯
Indicator
RSI
Breakout
XAUUSD
+5
Adaptive trend channel using linear regression and Pearson correlation for dynamic support, resistance, and trends.
Indicator
RSI
Breakout
Supertrend
"Identify key market zones and visualize support/resistance from multiple timeframes on a single chart.
Indicator
RSI
Breakout
XAUUSD
+5
πŸ“ŠZones Supply & Demand: Identifies key price levels with high volume concentration, marking Supply/Demand Zones & Marke
Indicator
RSI
Breakout
XAUUSD
+5
πŸ’Ή Define a price channel πŸ“ˆ and determine trend direction (bullish 🟒 or bearish πŸ”΄).
Indicator
RSI
Breakout
XAUUSD
+6
identify and highlight temporary market inefficiencies known as "fair value gaps" 🚨 within specific trading Sessions.
Indicator
RSI
Breakout
XAUUSD
+4
Identify market structure effortlessly with swing highs, lows, CHoCH, and BOS levels for smart trading decisions! πŸ“ŠπŸ”"
Indicator
Indices
RSI
XAUUSD
+7
Detects bullish and bearish divergences
Indicator
RSI
Breakout
Supertrend
πŸ“Š Liquidation Map: Potential areas where highly leveraged investors might face liquidations.

You may also like

Indicator
Grid
NAS100
NZDUSD
+15
The FZ indicator draws Fibonacci channel zones based on the highest and lowest prices over a user-defined period.
Indicator
NAS100
RSI
NZDUSD
+17
Institutional liquidity map for XAUUSD. Spot stop hunts, find the next target, and get a full trade setup automatically.
Indicator
Indices
Prop
FVG
+6
SMC indicator for cTrader detecting order blocks, fair value gaps, liquidity sweeps and market structure with buy/sell
Indicator
Grid
NAS100
NZDUSD
+13
PhantomGrid draws clear grid levels to help spot entries, exits, and key price zones with ease.
Indicator
Indices
Prop
Stocks
+3
Visualize the four major trading sessions with color-coded rectangles showing session high/low ranges.
Indicator
NAS100
RSI
NZDUSD
+14
Scalping & Swing signals in one. Smart S/R, Auto SL/TP, HTF panel. No repainting. Built for serious traders.
Indicator
NAS100
NZDUSD
XAUUSD
+10
Sero is a stochastic-based momentum oscillator that gives clear, color-coded visual signals for market momentum shifts.
Indicator
NAS100
Breakout
XAUUSD
+6
GUPPY TREND MASTER V3.. Visualize Market Sentiment with the 38-EMA Rainbow The Guppy Trend Master 4X4 Indicator
Indicator
Grid
NAS100
NZDUSD
+19
Session Volume Profile
Indicator
NAS100
RSI
NZDUSD
+13
πŸš€ HAI QUANTUM v4.0 | The Ultimate Quantum Terminal for cTrader (Smart Money & Algorithmic Trading)
Indicator
Indices
Signal
AI
πŸ”₯ THIS BURNS JP225 INDICATOR – Professional Trading Signals
Indicator
Grid
Indices
XAUUSD
+6
Follow The Trend cBot - INDICATOR - displays two Moving Average Bands for cBot or for your own use
Since 03/10/2024
140
Sales
29.97K
Free installs