🚀 Channel Breakout System
This specialized algorithm is designed to confirm entry and exit points with precision 🎯 by combining multiple technical analysis elements to provide reliable signals.
🔍 How Does It Work?
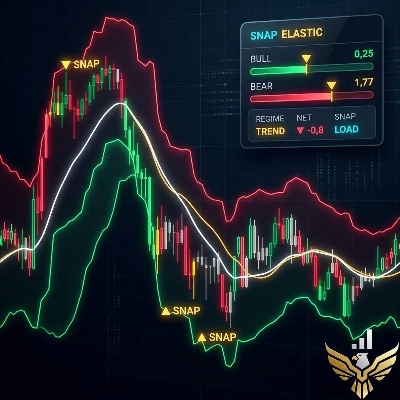
📊 Volatility-Based Channel (ATR)
✅ Market volatility is calculated using the ATR (Average True Range) 📉.
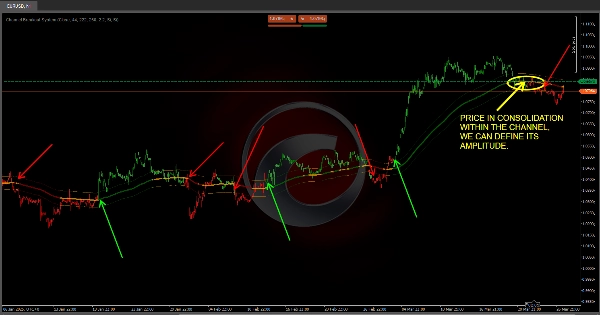
✅ The "Trend MA" is adjusted by adding and subtracting a value proportional to this volatility, forming two dotted lines that act as a "ceiling" and "floor" of the market.
✅ What does this mean for you? If the price stays within the channel, the market may be ranging or consolidating; if it clearly breaks out, it's a signal of a strong trend movement 📈📉.
✅ Fully customizable! Adjust the channel settings to match your strategy 📌.
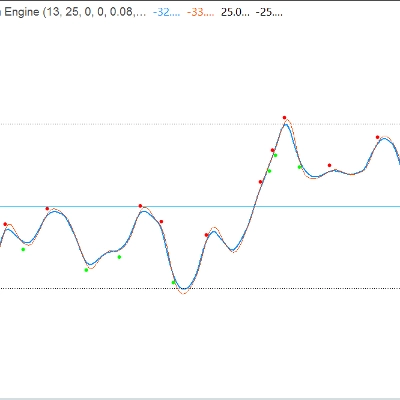
🟢 Trend Detection with Smart Colors
🔹 The indicator compares the position of the fast MA with the medium MA, and both in relation to the Trend MA.
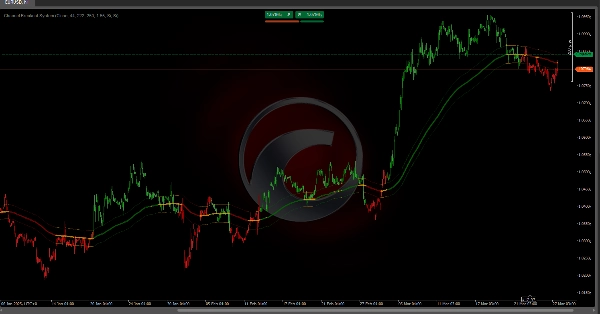
🔹 Based on the market phase, candles change color:
- 🟢 Green → Bullish market phase.
- 🔴 Red → Bearish market phase.
- 🟠 Orange or neutral → Possible consolidation or uncertainty.
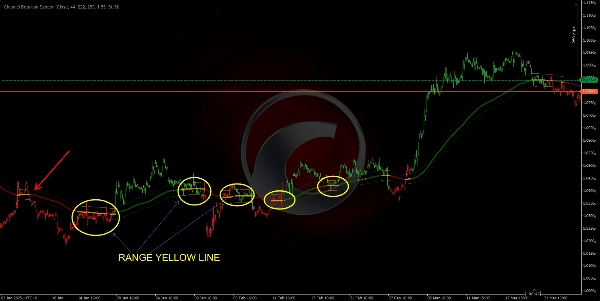
🔹 If the price and moving averages are "stuck" inside the channel, it signals a consolidation phase, helping you avoid trading in indecisive zones.
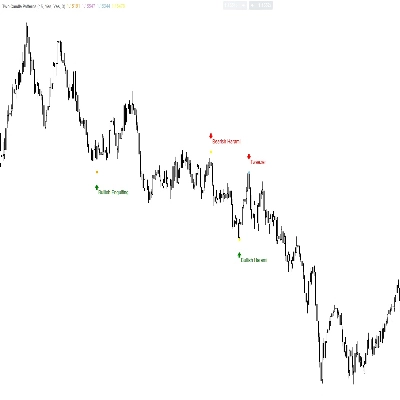
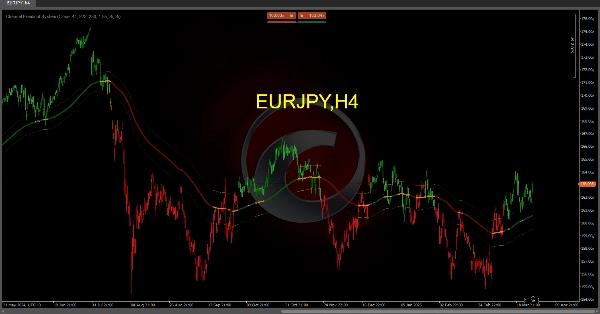
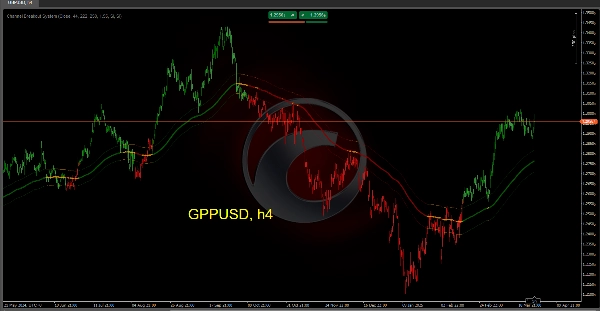
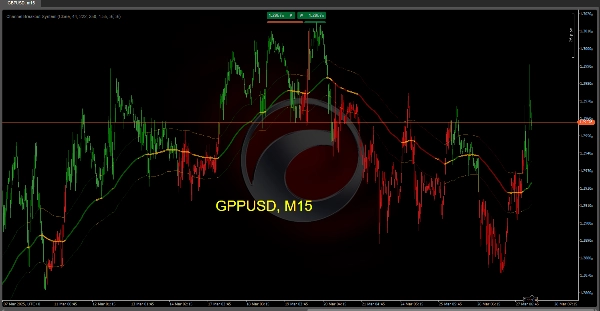
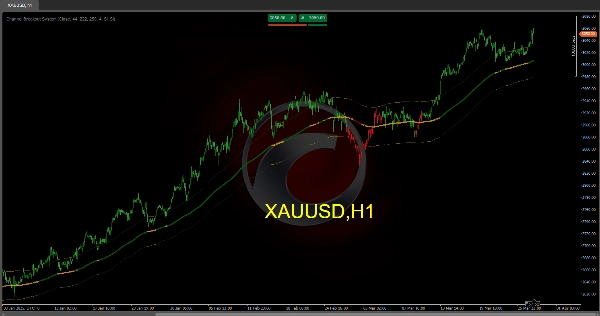
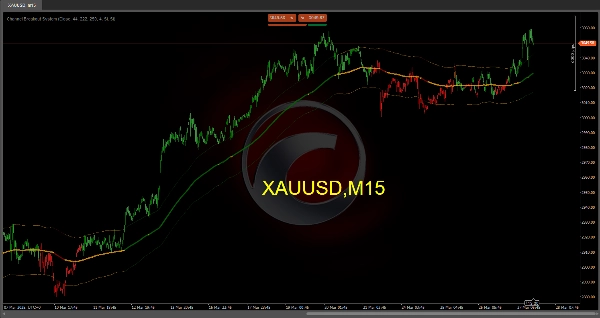
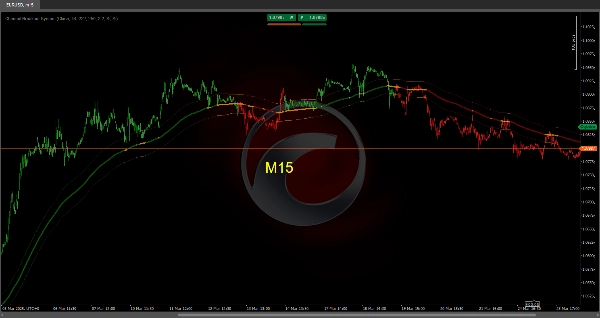
🎯 How It Looks on the Chart
🔵 Main trend line: Changes color depending on market direction (green, red, or orange).
📏 Dotted channel: Reflects market range based on volatility.
📊 Colored bars: Provide an easy visual representation of the current market phase.
🚀 Why Use This System?
✔ Quickly identifies whether the market is trending or ranging.
✔ Visually highlights trend strength and direction.
✔ Anticipates potential reversals with clear breakout and crossover signals.
✔ Confirms entry and exit points, reducing false signals and improving trade accuracy.
🔹 Optimize your trading and operate with greater confidence using Channel Breakout System 🏆. Get ready to spot the best market opportunities! 📈🔥
Ctrader Store indicators:
Dynamic Market Structure
Analysis of Turning Points
Fibonacci Linear
Regression Multi-timeframe
Multi-Level Candle Bias
Tracker
Auto Support and
Resistance Trend Lines
All Support and
Resistance Levels