Description
LogicLadder Pivots – Advanced Market Structure & Pattern Scanner
Unlock the hidden structure of the market with LogicLadder Pivots.
The LogicLadder Pivots indicator is a professional-grade price action tool designed to help traders visualize market structure, identify trends, and spot high-probability reversal patterns automatically. By combining classic ZigZag logic with advanced multi-timeframe monitoring, this tool acts as your personal market analyst, keeping your charts clean while alerting you to critical price movements.
🚀 Key Features
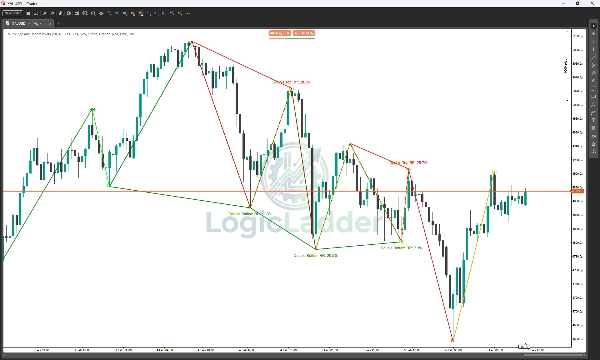
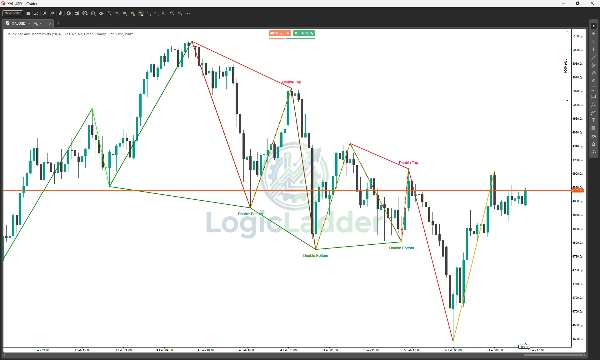
- Automated Market Structure: Automatically labels Higher Highs (HH), Lower Highs (LH), Higher Lows (HL), and Lower Lows (LL), giving you an instant read on the current trend direction.
- Smart Pattern Detection: Scans for Double Top and Double Bottom formations in real-time. It doesn't just find patterns; it filters them based on a calculated Risk-to-Reward (RR) ratio to ensure you only see the most actionable setups.
- Multi-Timeframe (MTF) Alerts: Monitor a higher timeframe (e.g., H4 or Daily) while trading on a lower timeframe. The indicator will alert you when key pivots form on your watcher timeframe, ensuring you never trade against the major trend.
- Interactive Stats Panel: A clean, on-chart dashboard displays the current status of pattern detection (Scanning, Double Top Detected, etc.).
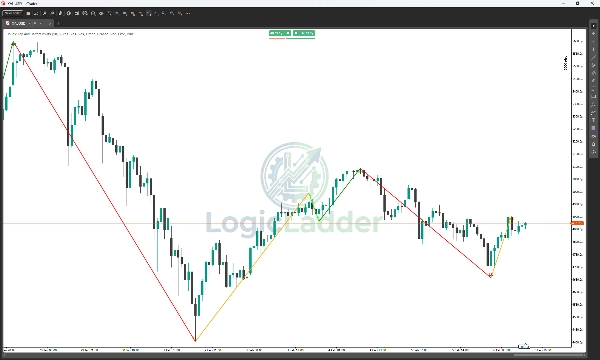
- ZigZag Visualization: Draws clear, customizable trend lines that cut through the noise, helping you focus on significant price swings.
- Fully Customizable: Tailor every aspect of the indicator to your trading style. Adjust pivot sensitivity (Length), change colors for Bullish/Bearish structures, and toggle distinct visual elements on or off.
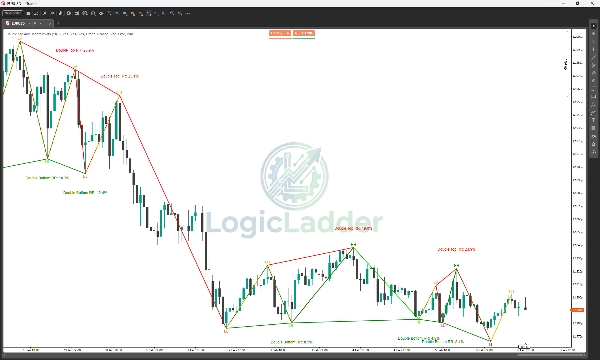
🎨 Visual Guide & Color Strategy
The LogicLadder system uses a specific 4-color code to tell you the story of the market structure instantly. Here is how to read the "Ladder":
1. 🟢 Green (Bullish - Strong)
- What it is: Used for Higher Highs (HH).
- What it means: Buyers are in full control. The market is making new highs.
- Action: Look for buying opportunities or hold existing long positions.
2. 🔴 Red (Bearish - Strong)
- What it is: Used for Lower Lows (LL).
- What it means: Sellers are in full control. The market is crashing to new lows.
- Action: Look for selling opportunities or hold existing short positions.
3. 🟠 Orange (Bull Trap - Weakness)
- What it is: Used for Lower Highs (LH).
- What it means: Buyers tried to push the price up but failed to break the previous high. This is a "Bull Trap"—late buyers are now trapped as momentum fades.
- Action: Warning sign! If you are Long, consider taking profits. Watch for a potential trend reversal to the downside.
4. 🟢 Lime (Bear Trap - Strength)
- What it is: Used for Higher Lows (HL).
- What it means: Sellers tried to push the price down but failed to break the previous low. This is a "Bear Trap"—late sellers are trapped as support holds.
- Action: Opportunity sign! This often signals the start of a new uptrend. Watch for entry signals to go Long.
📉 How to Trade the "Ladder"
- Uptrend Mode: You want to see a pattern of Green (HH) connected to Lime (HL). This confirms a healthy rising ladder.
- Downtrend Mode: You want to see a pattern of Red (LL) connected to Orange (LH). This confirms a steep falling ladder.
- Reversal Spotting:
- Potential Top: If you see a Green (HH) followed immediately by an Orange (LH), the uptrend is losing energy.
- Potential Bottom: If you see a Red (LL) followed immediately by a Lime (HL), the selling pressure is exhausted.
💡 How It Works
- Pivot Analysis: The indicator analyzes a user-defined lookback period (default: 10 bars) to identify significant swing highs and lows.
- Trend Logic: It connects these points to visualize the "Ladder" of price—showing you exactly when a trend is breaking structure or respecting support/resistance.
- Reversal Confirmation: When price action forms a "W" (Double Bottom) or "M" (Double Top) structure that meets your Risk/Reward criteria, the indicator draws the pattern on the chart and updates the status panel.
🔔 Alerts & Notifications
Stay informed without staring at the screen. LogicLadder Pivots includes a robust alert system:
- Log Alerts: Detailed messages printed to the cTrader log when patterns or pivots occur.
- MTF Monitoring: Get notified when a structural Pivot High or Low forms on your chosen alert timeframe (e.g., receive an alert for a 4-Hour Pivot Low while scalping the 5-Minute chart).
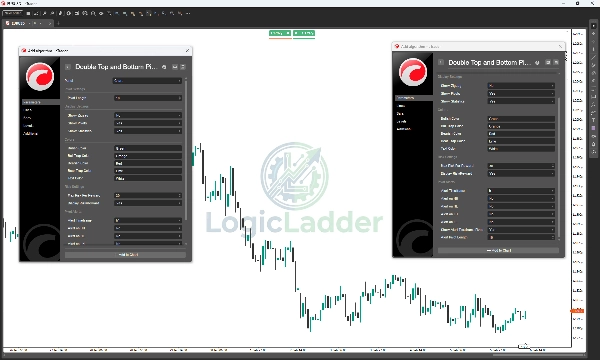
⚙️ Parameters
- Pivot Length: Sensitivity of the swing detection.
- Label Offset: Adjust the distance of text labels from the candle wicks for better visibility.
- Max Risk Per Reward: Filter patterns based on efficiency (default: 30%).
- Alert Timeframe: Choose a secondary timeframe to monitor.
- Visual Settings: Full control over colors for Bullish, Bearish, and Trap moves.
Summary
The indicator detects Double Top and Double Bottom reversal patterns in real-time, filtering them by a calculated Risk-to-Reward ratio to highlight the most actionable setups. It supports alerts for pivot formations on higher timeframes while trading on lower ones, helping users align trades with major trends.
A customizable on-chart stats panel displays the current pattern detection status, and clear ZigZag trend lines visualize significant price swings. Users can adjust pivot sensitivity, label positioning, and color schemes for bullish, bearish, and trap moves to fit their trading style.
The tool employs a four-color system to represent market conditions: green for strong bullish moves (HH), red for strong bearish moves (LL), orange for bull traps (LH), and lime for bear traps (HL). This visual guide aids in spotting trend continuations and potential reversals. Alerts include detailed log messages and MTF notifications to keep traders informed.