
Description
LogicLadder Smart SR Zones | Professional Support & Resistance
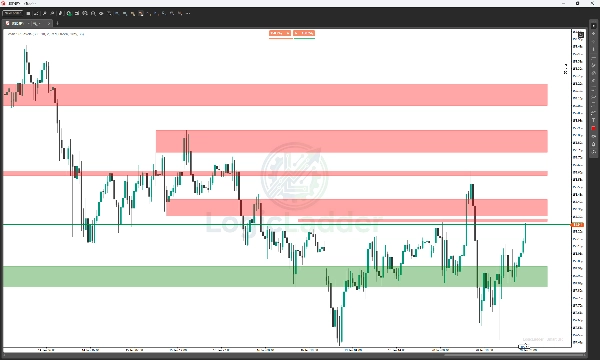
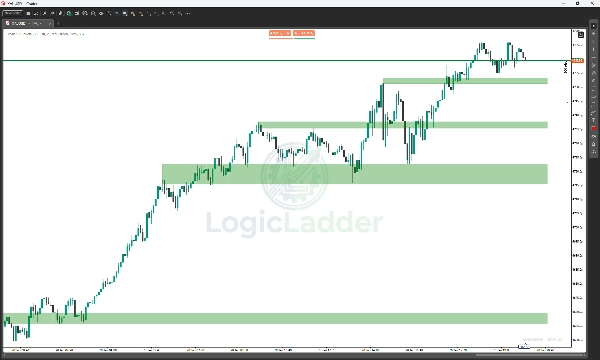
Stop guessing where the market will turn. LogicLadder Smart SR visualizes the institutional zones where price is likely to react. Designed for Price Action traders, this indicator instantly highlights the "floor" and "ceiling" of the market, allowing you to focus on execution rather than analysis.
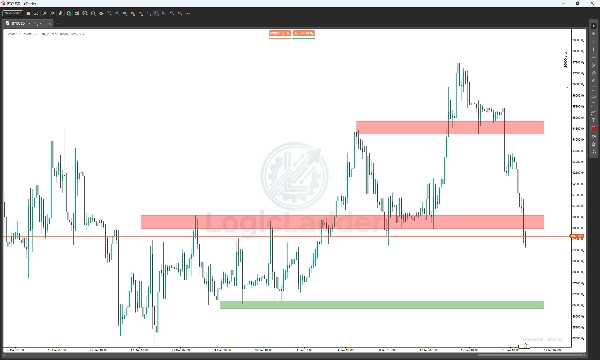
Perfect for Break & Retest strategies: Watch as a Green Support zone turns Red immediately after a breakdown, giving you a clear visual confirmation to look for sell setups.
Why use Smart SR?
- Visual Clarity: Instantly see where buyers and sellers are waiting.
- Reduce Noise: The "Pivot Strength" filter ignores minor market noise, showing you only the levels that matter.
- No Repainting: What you see on the chart is exactly what happened.
- Fully Customizable: Adjust colors, transparency, and look-back periods to fit your personal trading style.
Trading Tip: Wait for price to approach a "Fresh" zone (gray). If price bounces, enter with the trend. If price breaks through, wait for the color flip (Red/Green) and trade the retest.
Option 3: Short & Punchy (Best for Social Media / Discord)
Use this for quick shares.
Title: LogicLadder Smart SR Zones
Description: Automate your technical analysis with Smart SR Zones. This cTrader indicator detects key Pivot points and draws accurate Support & Resistance boxes that update in real-time.
✅ Auto-Color Switching: Zones flip Red/Green on breakouts.
✅ Lag-Free: Old zones are auto-deleted to keep charts fast.
✅ No Repainting: Fixed time-based anchors.
✅ Clean UI: Professional transparency and styling.
Summary
Key features include:
- Visual clarity with clear identification of buyer and seller zones.
- A "Pivot Strength" filter that reduces market noise by showing only significant levels.
- No repainting, ensuring that displayed zones reflect actual historical price action.
- Full customization options for colors, transparency, and look-back periods.
- Automatic deletion of outdated zones to maintain chart performance.
- Support for break and retest trading strategies by signaling zone flips after breakouts.
The indicator supports multiple markets including Forex, indices, commodities, stocks, and cryptocurrencies, with tags referencing popular symbols like BTCUSD, EURUSD, GBPUSD, XAUUSD, NAS100, and USDJPY. It provides a clean, professional user interface optimized for efficient technical analysis.


!["[Stellar Strategies] Moving Averages Combined 1.0" logo](https://cdn.ctrader.com/image/webp/93692c9d-ac16-4dd8-ba83-5a62250c39a9_27250)


!["High-Low Divergence [Iridio Capital]" logo](https://cdn.ctrader.com/image/webp/443c4661-7abb-40f1-842f-4b6ec560649b_40914)