Description
SmartTrendScanner
Overview
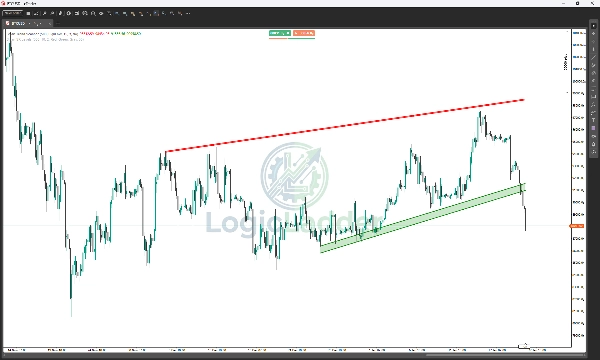
SmartTrendScanner is a professional-grade cTrader indicator designed to automate the subjective art of trend analysis. Unlike traditional indicators that draw thin, single-price trendlines, SmartTrendScanner identifies and visualizes dynamic Supply & Demand Cloud Zones.
Powered by a "Best-Fit" algorithm, it scans historical price action to find the most mathematically significant connection points, drawing filled channels that represent the true area of support and resistance.
Key Features
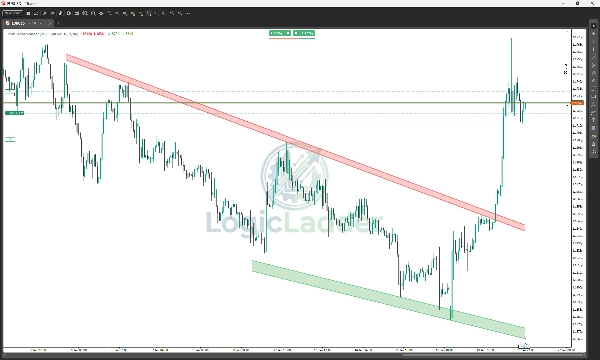
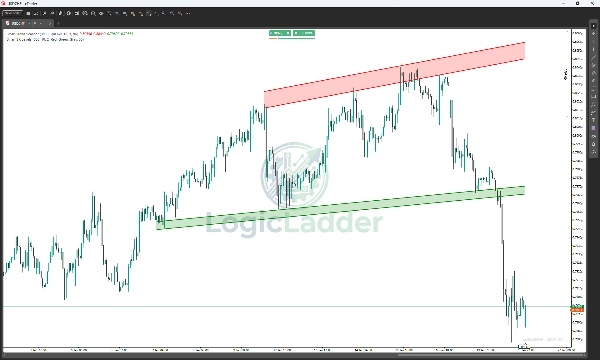
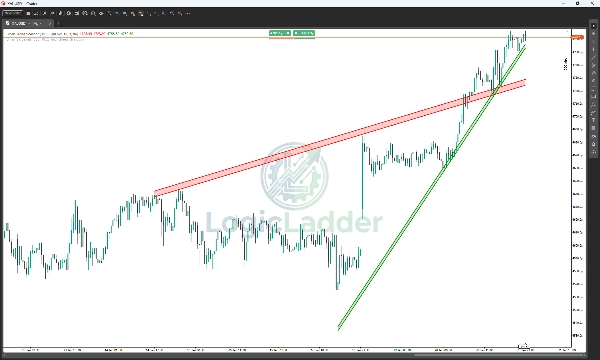
- Dynamic Cloud Zones: Replaces thin lines with filled "cloud" channels, visually covering the entire range of price touches (wicks and bodies) to prevent fake-outs.
- Intelligent Pivot Detection: Automatically identifies key Swing Highs and Swing Lows based on your custom sensitivity settings.
- Best-Fit Algorithm: The indicator creates thousands of potential trendlines in the background and filters them to display only the strongest, most respected zones closest to the current price.
- Stability Filters: Built-in logic checks for broken structures, ensuring you don't trade off invalid or outdated levels.
- Real-Time Alerts: Never miss a move. Get instant popup and sound notifications when price breaks out of a zone or retests a level.
- Fully Customizable: Adjust cloud transparency, colors, pivot strength, and lookback history to fit your trading style (Scalping, Day Trading, or Swing).
How It Works
- Scans History: The indicator looks back a user-defined number of bars (e.g., 300 bars) to find fractal pivot points.
- Connects the Dots: It tests connections between pivots to find valid trend slopes.
- Validates the Zone: It checks if price has "touched" the projected line enough times (Min Touches) without breaking it significantly in the recent past.
- Draws the Cloud: Once a valid trend is found, it draws a transparent cloud between the highest wick touch and the lowest body touch, creating a "Zone of Action."
Settings Guide
- Bars to Apply: How far back in history the scanner looks (Default: 300). Increase this for long-term swing trading.
- Pivot Strength: The sensitivity of the fractal detection. Higher numbers (e.g., 15+) find major structural points; lower numbers (e.g., 5) find minor internal structure.
- Min Pivot Confirmation: The minimum number of times price must touch the zone for it to be considered valid.
- Zone Transparency: Controls the opacity of the fill color (0 = Invisible, 255 = Solid).
Why LogicLadder?
Trading is about probability, not certainty. By visualizing Support and Resistance as zones rather than thin lines, SmartTrendScanner helps you see where the real liquidity is hiding, keeping you one step ahead of the crowd.
Summary
Key features include dynamic cloud zones that cover the full price range to reduce false signals, intelligent pivot detection adjustable by sensitivity, stability filters to avoid outdated levels, and real-time alerts for breakouts or retests. Users can customize settings such as lookback period, pivot strength, minimum touches for zone validation, and cloud transparency to suit various trading styles including scalping, day trading, and swing trading.
Smart Trend Scanner supports multiple markets including Forex, commodities, stocks, and cryptocurrencies, with symbol tags like BTCUSD, EURUSD, GBPUSD, XAUUSD, and NAS100. It aims to provide clearer visualization of liquidity zones to assist traders in making informed decisions based on probabilistic support and resistance areas.