
VegaXLR - Bar Close Alert Manager
Indicator
5 purchases
Version 1.0, Jan 2025
Windows, Mac
5.0
Reviews: 3
Description
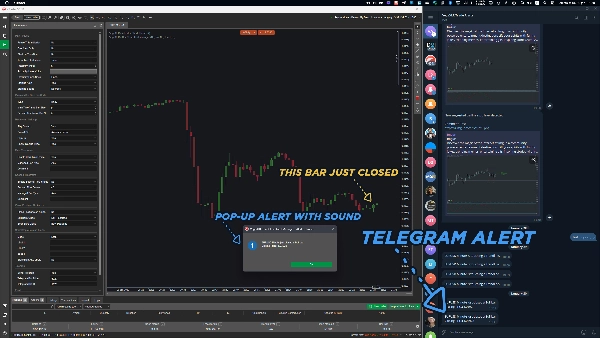
VegaXLR - Bar Close Alert Manager provides real-time alerts when a bar or candlestick closes. With customizable notifications via sound, pop-up messages, Telegram, and email, traders stay informed of market movements. It works on all time frames, especially Tick, Renko, and Range charts.
This tool allows users to personalize alerts, add comments, and track different time frames. Traders can specify the bar type (bullish, bearish, or both) that triggers an alert and display the last bar’s closing price. It also supports automation, including cBot control and position management.
Key Features:
- Real-Time Alerts: Notifications when a bar closes.
- Customizable Notifications: Sound, pop-ups, Telegram, and email alerts.
- Play/Pause Alerts: Enable or disable alerts easily.
- Custom Notes: Add comments to alerts.
- Multi-Time Frame Support: Track two time frames on the same chart.
- Bar Type Selection: Alerts for bullish, bearish, or both bar types.
- Closing Price Display: Show the last closed bar’s price in alerts.
- Tick, Renko & Range Support: Ideal for non-time-based charts.
- One Alert Mode: Option to trigger only one alert before stopping.
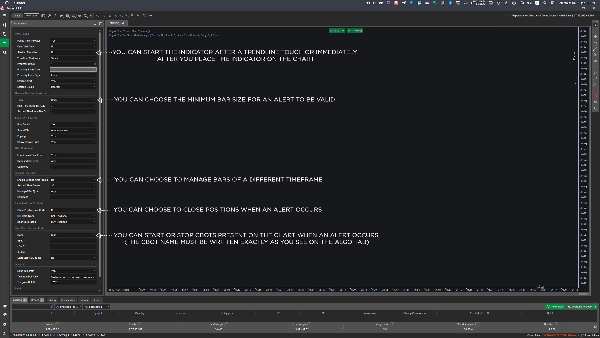
- Minimum Bar Size: Set a minimum bar size for alerts.
- cBot Automation: Start or stop cBots when an alert occurs. (The cBot must be on the chart)
- Position Management: Close all positions on alert.
- Built-in Sound Alerts: Uses cTrader’s default sounds.
- Trendline Activation: Start the indicator when price interacts with a trendline.
- Trendline Start Modes: Start after a touch, bar close, or price proximity.
VegaXLR - Bar Close Alert Manager is a must-have for forex and crypto traders, offering powerful alerts and automation for better trading decisions.
Summary
AI summary
VegaXLR - Bar Close Alert Manager is an indicator designed for forex and cryptocurrency traders to receive real-time alerts when a bar or candlestick closes. It supports all time frames, including Tick, Renko, and Range charts, making it suitable for both time-based and non-time-based chart types. Users can customize notifications through sound, pop-up messages, Telegram, and email, and can easily enable or disable alerts.
The tool allows specifying alert triggers based on bar type—bullish, bearish, or both—and displays the closing price of the last bar in alerts. It supports tracking two time frames simultaneously on the same chart and enables adding custom notes to alerts. Additional features include setting a minimum bar size for alerts, a one-alert mode to trigger a single notification before stopping, and built-in sound alerts using the platform’s default sounds.
VegaXLR integrates automation capabilities such as starting or stopping cBots upon alerts (with cBots present on the chart) and managing positions by closing all open trades when an alert occurs. It also offers trendline activation with configurable start modes based on price interaction. This combination of alert management and automation aims to assist traders in monitoring market movements and executing timely decisions.
Indicator profile
Customer reviews
5.0
Reviews: 3
5 | 100 % | |
4 | 0 % | |
3 | 0 % | |
2 | 0 % | |
1 | 0 % |
Customer reviews
February 2, 2025
Clear market reviewer for chart reading. it makes market context easier to scan, especially when used for adding confirmation before a trade. I would test it on 2 timeframes, 20 signals and a 1R stop plan. It is stronger when a 1.5R target is realistic before the entry.
February 1, 2025
February 1, 2025
Patient setup filter for a more controlled workflow. It helps with adding confirmation before a trade, but it should not be used as a blind entry trigger. I would test it on 2 timeframes, 20 signals and a 1R stop plan. I would still keep manual review in the process.
Discussion
FAQ
Forex
Crypto
Products available through cTrader Store, including trading bots, indicators and plugins, are provided by third-party developers and made available for informational and technical access purposes only. cTrader Store is not a broker and does not provide investment advice, personal recommendations or any guarantee of future performance.


Price
231
Sales
692
Free installs