
Description
Revolutionize Your Trading with the Ultimate cTrader Chart Pattern Indicator
Take your trading strategy to the next level with this cutting-edge cTrader indicator, expertly designed to detect and highlight critical chart patterns for precise market analysis. This advanced tool identifies key patterns such as Double Tops, Head and Shoulders, Ascending Triangles, and more, providing traders with a powerful edge in forex, stock market trading and all markets present in the cTrader platform.
Key Features:
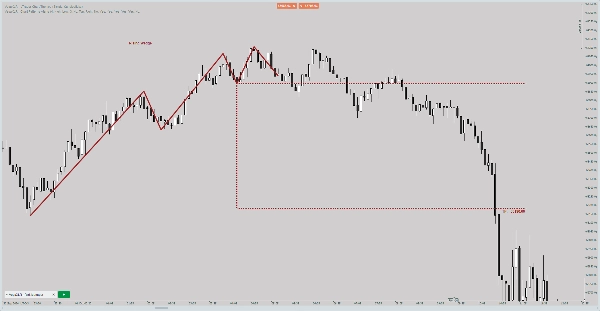
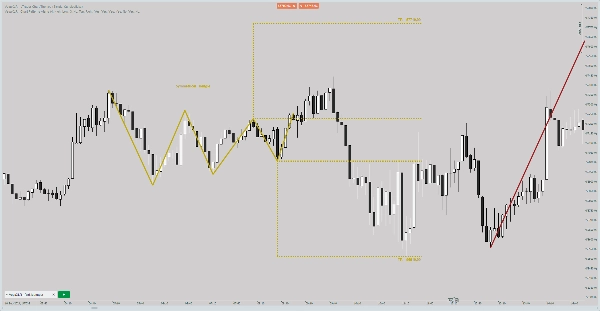
- Automatic Chart Pattern Detection: Instantly spot patterns like Bullish Flags, Symmetrical Triangles, and Rising Wedges.
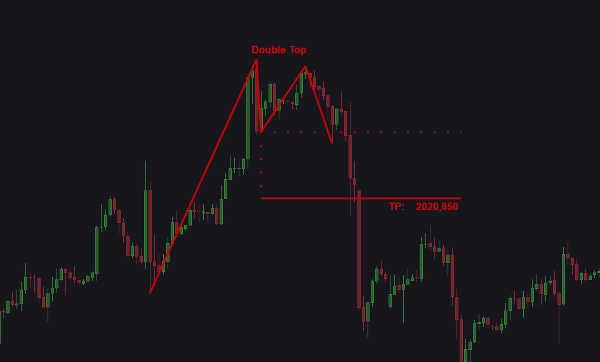
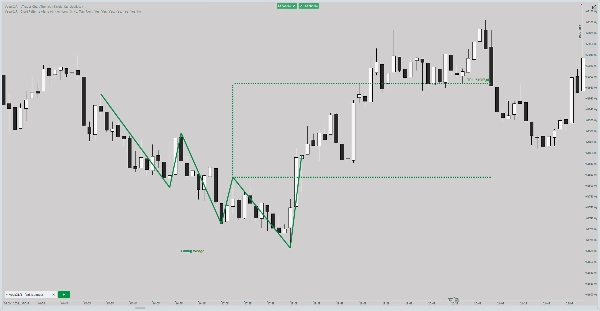
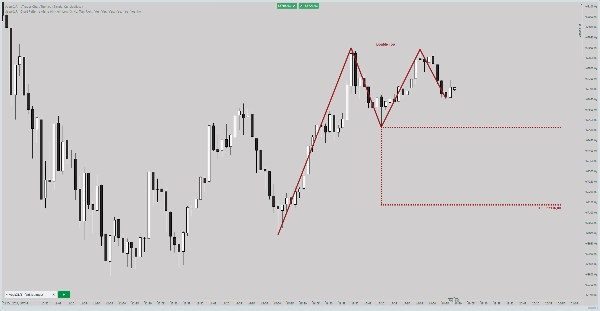
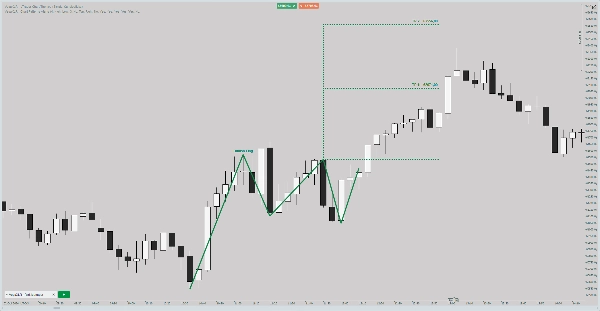
- Pattern Swing Plotting: Visualize necklines, target lines, and price movements with ease.
- Customizable Alerts: Stay informed with alerts via Sound, Pop-up, Telegram, or Email—tailored to your needs.
- Color-Coded Insights: Quickly differentiate between bullish, bearish, and neutral patterns using customizable color schemes.
- Pattern List with Stats: Easily track pattern occurrences with an integrated list showing abbreviations and counts.
- Adjustable Zoom Levels: Focus on specific pattern sizes for detailed analysis.
- Profit Potential Display: Evaluate potential trade opportunities with clear profit size indications.
- Timeframe and Symbol Clarity: Alerts include precise details on the symbol and timeframe for informed decision-making.
- Pause Alerts Option: Analyze patterns without distractions by pausing notifications.
- User Notes Feature: Add comments for strategy refinement or pattern-specific notes.
Chart Patterns Detected:
- Double Top
- Double Bottom
- Head and Shoulders
- Inverse Head and Shoulders
- Symmetrical Triangle
- Ascending Triangle
- Descending Triangle
- Bullish Flag
- Bearish Flag
- Rising Wedge
- Falling Wedge
This intuitive trading indicator empowers traders by combining automated chart pattern detection, customizable alerts, and real-time visualizations. Whether you're trading in the forex market, analyzing stock charts, or exploring cTrader custom indicators, this tool provides the insights you need to make smarter, more confident decisions. Perfect for traders seeking to master technical analysis and optimize their risk management strategies.
Unlock your trading potential today with this comprehensive cTrader indicator!
Warning:
This indicator is a technical analysis tool designed to assist traders by providing insights and visualizations based on chart patterns and market data. It does not function as a standalone trading solution and does not guarantee profitable results. Users must implement their own trading strategies, risk management, and decision-making processes when using this product. Past performance is not indicative of future results. Trading in financial markets involves significant risk, and you should only trade with capital you can afford to lose.
Summary
Key functionalities include automatic pattern detection, real-time visualization of pattern components like necklines and target lines, and customizable alerts delivered via sound, pop-up, Telegram, or email. It features color-coded insights to distinguish bullish, bearish, and neutral patterns, a pattern list with occurrence statistics, adjustable zoom levels for detailed analysis, and profit potential display to evaluate trade opportunities. Alerts provide clear symbol and timeframe information, and users can pause notifications or add personal notes for strategy refinement.
This tool assists traders in technical analysis and risk management by providing actionable insights based on chart patterns. It is intended as a supportive tool and does not function as a standalone trading solution. Users must apply their own trading strategies and risk controls when using this indicator.
Customer reviews
5 | 67 % | |
4 | 0 % | |
3 | 33 % | |
2 | 0 % | |
1 | 0 % |


