
Description
The Triple Momentum indicator is a comprehensive technical analysis tool for the cTrader platform, designed to provide traders with a multi-faceted view of market momentum. By integrating three powerful trend-following indicators into one, it helps users confirm signals, identify trend strength, and make more informed trading decisions. The indicator plots directly onto the main price chart for seamless analysis.
Core Components:
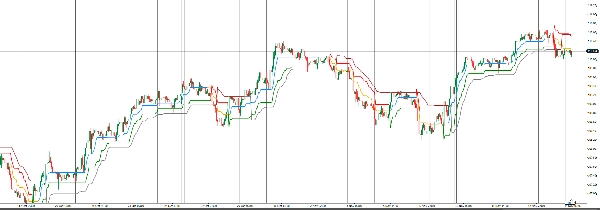
- Line 1: A custom-built, responsive trend line that uses Bollinger Bands breakouts to determine its initial direction. An optional ATR filter helps smooth its movement, creating a dynamic support and resistance level that trails the price. The line is colored Dodger Blue during an uptrend and Orange during a downtrend.
- Line 2: A classic and widely-used trend indicator based on the Average True Range (ATR). It provides clear buy and sell signals when the price crosses above or below its value. This component includes:
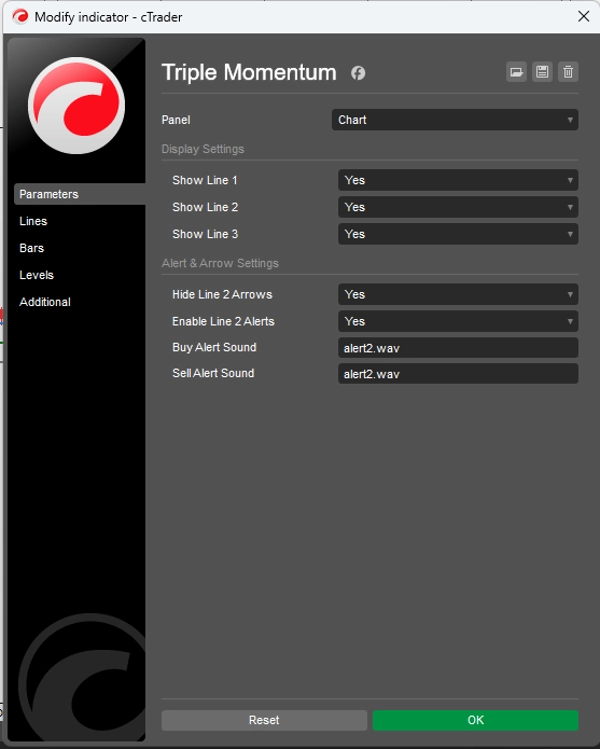
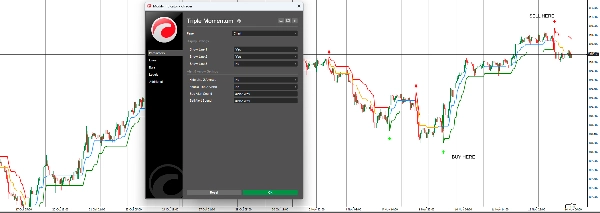
- On-Chart Arrows: Visual up/down arrows appear at each trend change.
- Customizable Alerts: Users can enable pop-up and sound alerts for buy/sell signals, ensuring they never miss a potential entry or exit.
- Line 3: Standing for "Profitable Maximum," this is another robust ATR-based indicator that uses a moving average as its core. It is designed to capture strong trends while filtering out minor market noise. The line’s color directly reflects the underlying momentum: Gray for a bullish (buy) trend and Brown for a bearish (sell) trend.
Key Features:
- Fully Customizable: Each of the three indicator lines can be toggled on or off independently from the settings menu.
- Clear Visual Signals: The color-coded lines and optional arrows make it easy to interpret the market trend at a glance.
- Integrated Alert System: Stay notified of key trend changes with configurable pop-up and sound alerts for the SuperTrend signals.
By combining these three distinct calculations, the Triple Momentum indicator offers a robust system for trend confirmation, allowing traders to approach the market with greater confidence.
Summary
AI summary
The Triple Momentum indicator for cTrader is a technical analysis tool designed to provide a comprehensive view of market momentum by combining three trend-following components into one indicator displayed on the main price chart.
Core components include:
1. A custom trend line based on Bollinger Bands breakouts with an optional ATR filter, serving as a dynamic support and resistance level. It changes color to Dodger Blue for uptrends and Orange for downtrends.
2. An ATR-based trend indicator that signals buy and sell points when price crosses its value, featuring on-chart arrows and customizable pop-up and sound alerts for trend changes.
3. The "Profitable Maximum," another ATR-based line using a moving average to capture strong trends while filtering noise, colored Gray for bullish trends and Brown for bearish trends.
Key features allow independent toggling of each line, clear color-coded visual signals, and an integrated alert system for SuperTrend signals. This indicator supports analysis across multiple markets including forex, indices, commodities, stocks, and cryptocurrencies, aiding traders in confirming trends and making informed decisions.
Indicator profile
Customer reviews
0.0
Reviews: 0
Customer reviews
No reviews for this product yet. Already tried it? Be the first to tell others!
Discussion
FAQ
Signal
Indices
Commodities
GBPUSD
RSI
Bollinger
Fibonacci
Scalping
AI
XAUUSD
NAS100
MACD
BTCUSD
Forex
Breakout
EURUSD
NZDUSD
Martingale
Prop
ZigZag
Supertrend
Fair Value Gap
SMC
Crypto
Stocks
ATR
USDJPY
VWAP
Products available through cTrader Store, including trading bots, indicators and plugins, are provided by third-party developers and made available for informational and technical access purposes only. cTrader Store is not a broker and does not provide investment advice, personal recommendations or any guarantee of future performance.


!["[Stellar Strategies] Smart ADX" logo](https://cdn.ctrader.com/image/webp/af13b084-b6f6-41db-b7bc-c7e688b57b05_36929)

Price
Since 02/07/2025
1
Sales