
Description
Weekly & Daily Opening Gaps — NWOG & NDOG Indicator
Professional-grade opening gap visualization for institutional traders and serious retail participants
OVERVIEW
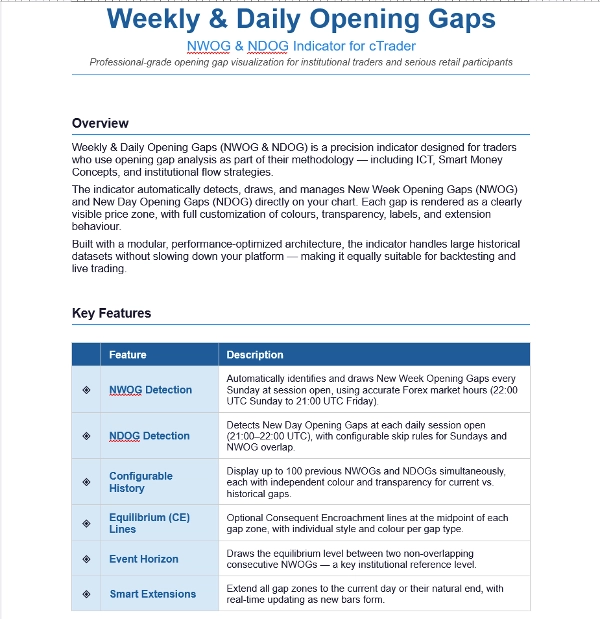
Weekly & Daily Opening Gaps (NWOG & NDOG) is a precision indicator designed for traders who use opening gap analysis as part of their methodology — including ICT, Smart Money Concepts, and institutional flow strategies.
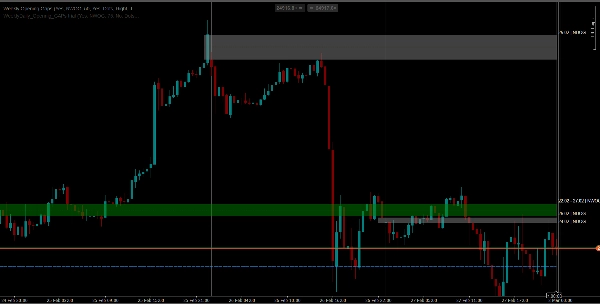
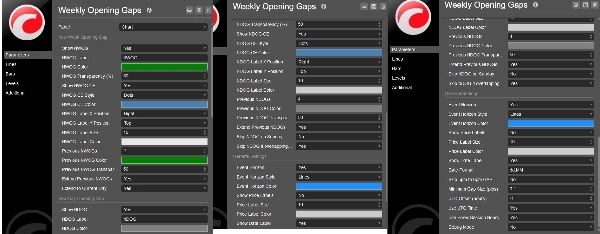
The indicator automatically detects, draws, and manages New Week Opening Gaps (NWOG) and New Day Opening Gaps (NDOG) directly on your chart. Each gap is rendered as a clearly visible price zone, with full customization of colours, transparency, labels, and extension behaviour.
Built with a modular, performance-optimized architecture, the indicator handles large historical datasets without slowing down your platform — making it equally suitable for backtesting and live trading.
KEY FEATURES
◈ NWOG Detection
◈ NDOG Detection with configurable skip rules for Sundays and NWOG overlap.
◈ Configurable History — Display up to 100 previous NWOG
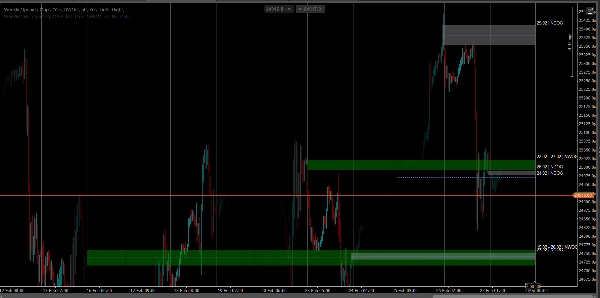
◈ Equilibrium (CE) Lines
◈ Event Horizon — Draws the equilibrium level between two non-overlapping consecutive NWOGs
◈ Smart Extensions — Extend all gap zones to the current day or their natural end, with real-time updating as new bars form.
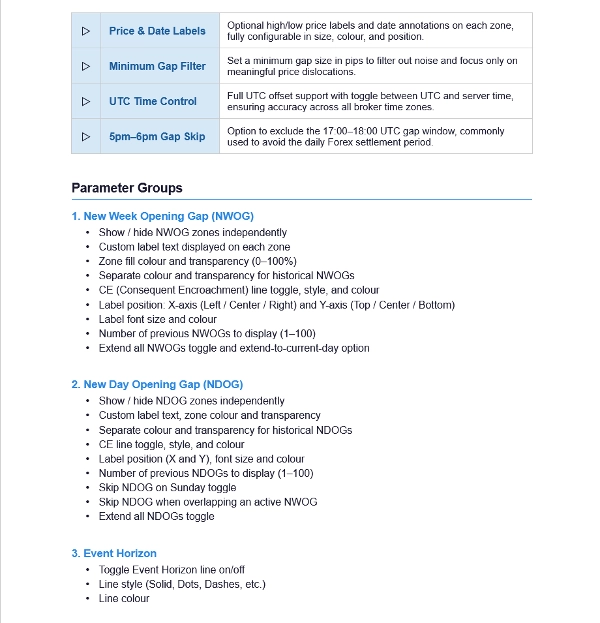
◈ Price & Date Labels
◈ Minimum Gap Filter
◈ UTC Time Control
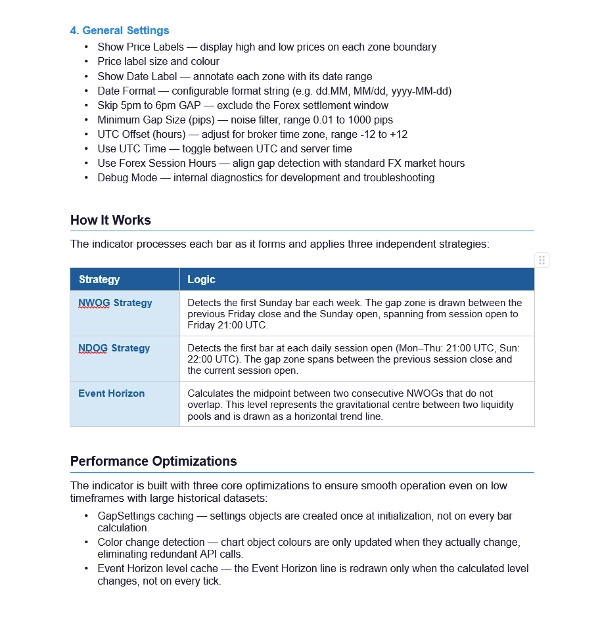
HOW IT WORKS
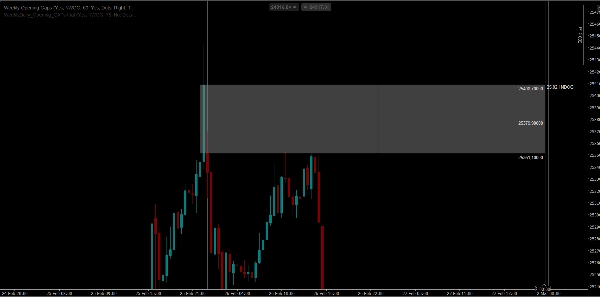
NWOG Strategy — Detects the first Sunday bar each week. The gap zone is drawn between the previous Friday close and the Sunday open, spanning from session open to Friday 21:00 UTC.
NDOG Strategy — Detects the first bar at each daily session open (Mon–Thu: 21:00 UTC, Sun: 22:00 UTC). The gap zone spans between the previous session close and the current session open.
Event Horizon — Calculates the midpoint between two consecutive NWOGs that do not overlap. This level represents the gravitational centre between two liquidity pools and is drawn as a horizontal trend line.
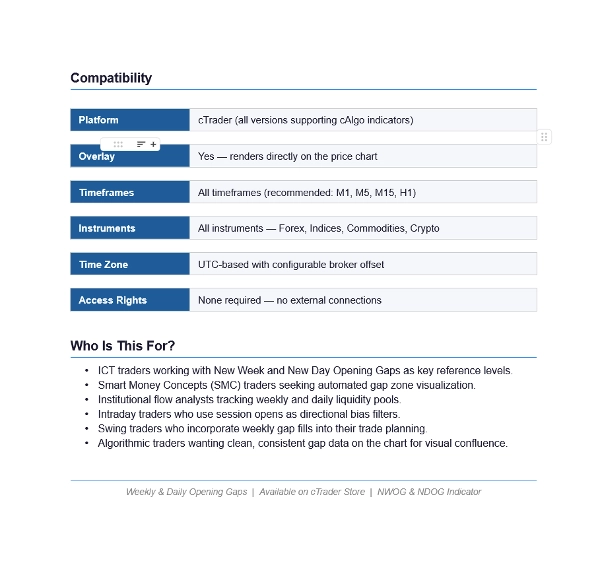
COMPATIBILITY
Platform: cTrader (all versions supporting cAlgo indicators)
Overlay: Yes — renders directly on the price chart
Timeframes: All timeframes (recommended: M1, M5, M15, H1)
Instruments: All — Forex, Indices, Commodities, C
WHO IS THIS FOR?
ICT traders working with New Week and New Day Opening Gaps as key reference levels
Smart Money Concepts (SMC) traders seeking automated gap zone visualization
Institutional flow analysts tracking weekly and daily liquidity pools
Intraday traders who use session opens as directional bias filters
Swing traders who incorporate weekly gap fills into their trade planning
Algorithmic traders wanting clean, consistent gap data on the chart for visual confluence
Summary
Customer reviews
5 | 0 % | |
4 | 100 % | |
3 | 0 % | |
2 | 0 % | |
1 | 0 % |


!["[Stellar Strategies] Market Session Ultimate" logo](https://cdn.ctrader.com/image/webp/61ffd537-0125-4246-9e72-42eca1791d64_28232)

