
Description
🔧 ATR_RR_SignalPanel — Technical & Detailed Description (EN) 🧠📈
ATR_RR_SignalPanel is an overlay indicator for cTrader that generates trend-change entry signals using a Fast EMA vs Slow EMA regime, then builds a complete virtual trade framework (Entry 🏁, Stop Loss 🛑, Final Take Profit 🎯, Intermediate Targets 🟢) using ATR-based risk sizing and a configurable Risk:Reward multiplier ⚖️.
🧭 Core Logic (Signal Engine) 🚦
- The indicator computes:
- Fast EMA ⚡ and Slow EMA 🐢 on Close.
- ATR (Wilder smoothing) 🌡️ for volatility-based stop distance.
- A trend regime is defined as:
- Bull trend 🟢 when
Fast EMA > Slow EMA - Bear trend 🔴 when
Fast EMA < Slow EMA
- Bull trend 🟢 when
- A Trend Change 🔁 triggers when the bull/bear state differs from the previous bar (equivalent to Pine’s
bullTrend != bullTrend[1]).
🎯 Entry Conditions (BUY/SELL) 🟩🟥
When a trend change occurs:
- BUY signal 🟢 if:
- Bull trend is active and a trend change is detected
- Optional candle confirmation ✅: Close > Open (bullish candle)
- SELL signal 🔴 if:
- Bear trend is active and a trend change is detected
- Optional candle confirmation ✅: Close < Open (bearish candle)
🧪 Virtual Position Management (Not a cBot) 🧩
This indicator does not place orders. Instead it simulates an internal “virtual position”:
- On a new BUY/SELL signal it sets:
- Entry Price = current close 🏁
- Stop Loss = candle extreme ± ATR × multiplier 🛑
- Final Take Profit = Entry ± (Risk × RiskReward) 🎯
- Intermediate TP levels = steps at 1R, 2R, … up to floor(RR)-1 🟢
- It monitors price action bar-by-bar:
- If TP final is touched ➜ marks 🎯 and closes virtual position ✅
- If SL is touched ➜ marks 🛑 and closes virtual position ❌
- Intermediate TP hits are tracked only once 🧷
🔁 Invalidation Logic (Opposite Signal While Active) ⚠️
If a new signal arrives while a virtual trade in the opposite direction exists:
- The previous entry is marked as INVALIDATED ⚠️ (INV BUY / INV SELL)
- The prior virtual position is terminated 🧯
- A new virtual position is created in the new direction 🔄
🧼 Multi-Instance Safe (Multiple Copies on Same Chart) 🧩🧩
Each indicator instance generates a unique internal ID 🆔, so:
- Lines/text from one instance won’t overwrite another instance ✅
- You can run several configurations in parallel (e.g., scalping + swing) 🧠📊
🧯 Anti-Clutter Controls (Markers Limiter) 🧹✨
To keep charts readable, it can:
- Limit the number of text markers drawn (BUY/SELL/TP/SL/INV/TP1…) 🧾
- Automatically delete older markers when the limit is exceeded ♻️
🧷 Optional “Keep Last Risk Lines” 🧠📌
When enabled, the last Entry/SL/TP lines remain visible even after TP/SL closes:
- Great for post-trade review 🧑🔬
- Great for journaling 📒✅
⚙️ Parameters — Detailed Explanation (EN) 🔍📌
📈 Signal & Risk Core
⚡ Fast EMA
- What it does 🧠: Sets the period of the fast EMA used to detect regime shifts.
- Effect 📊: Lower values = more reactive ➜ more signals; higher = smoother ➜ fewer signals.
- Typical ranges 🎛️: 3–10 for fast markets ⚡, 10–20 for calmer setups 🐢
🐢 Slow EMA
- What it does 🧠: Sets the period of the slow EMA used as the trend baseline.
- Effect 📊: Higher slow EMA = stronger filtering ➜ fewer trend-change triggers.
- Typical ranges 🎛️: 13–55 depending on style 🧭
🌡️ ATR Period
- What it does 🧠: Controls volatility measurement length for ATR.
- Effect 📏: Short ATR reacts quickly (tighter SL), long ATR stabilizes (steadier SL).
- Typical ranges 🎛️: 10–21 is common ✅
🛑 SL Multiplier (ATR)
- What it does 🧠: Defines Stop Loss distance in ATR units.
- Long 🟢:
SL = Low - ATR * Mult - Short 🔴:
SL = High + ATR * Mult - Effect 🎯: Higher multiplier = wider SL (fewer stops, bigger risk); lower = tighter SL (more stops).
- Typical values 🎛️: 0.3–2.0 depending on volatility 🌪️
⚖️ Risk:Reward (R:R)
- What it does 🧠: Multiplies the “risk” distance to compute final TP.
- Formula 📌:
- Risk = |Entry − SL|
- Final TP = Entry ± Risk × RR 🎯
- Intermediate TPs 🟢: TP1 at 1R, TP2 at 2R, … up to
floor(RR)-1 - Example 🧪: RR=3 ➜ TP1 (1R), TP2 (2R), Final TP (3R) 🎯🎯🎯
✅ Require candle confirmation
- What it does 🧠: Adds candle direction validation on the signal bar.
- BUY 🟢: requires Close > Open
- SELL 🔴: requires Close < Open
- Effect 🧽: Filters out weak flips, reduces noise, may enter later ⏳
📌 EMAs Display
👁️ Show Fast EMA
- What it does 🧠: Shows/hides the fast EMA line.
- Use case 💡: Hide if you want a clean chart 🧼
👁️ Show Slow EMA
- What it does 🧠: Shows/hides the slow EMA line.
- Use case 💡: Keep visible for trend context 🧭
🎛️ Visual Controls (Clutter Management) 🧹✨
🚦 Show Signals
- What it does 🧠: Shows/hides BUY/SELL markers.
- Includes 🧷: BUY 🟢 / SELL 🔴 markers (only)
- Tip 💡: Disable for “lines-only” mode 📏
🏷️ Show TP Labels
- What it does 🧠: Shows/hides labels like TP1, TP2…
- Effect 🧼: Turning OFF removes lots of text noise on higher TFs 📉
- Note 🧷: Labels appear only once per TP hit ✅
⚠️ Show Invalidation Marks
- What it does 🧠: Shows/hides INV BUY / INV SELL markers.
- Use case 🧠: Useful when you want to study signal reversals 🔁
🎯🛑 Show Final TP/SL Marks
- What it does 🧠: Shows/hides final TP and SL markers.
- Use case 📒: Great for reviewing outcome distribution 🎲
📏 Show Risk Lines (Entry/SL/TP)
- What it does 🧠: Draws Entry 🏁, SL 🛑, Final TP 🎯 lines on the chart.
- Effect 📌: Visualizes the virtual trade structure instantly 🧠
🟢 Show Intermediate TP Lines
- What it does 🧠: Draws dotted lines for TP1/TP2/... levels.
- Tip 🧼: Disable if chart gets too “green spaghetti” 🍝🟢
📌 Keep Last Risk Lines
- What it does 🧠: Keeps the last Entry/SL/TP lines visible after virtual exit (TP/SL).
- Why it’s useful 📒: Perfect for journaling & post-trade analysis 🧑🔬✅
🧾 Max Markers On Chart (0=unlimited)
- What it does 🧠: Limits how many text objects the indicator leaves on the chart.
- How it works ♻️: When the limit is exceeded, the oldest markers are removed automatically.
- Recommended 🎛️: 80–200 depending on timeframe and history depth 🕰️
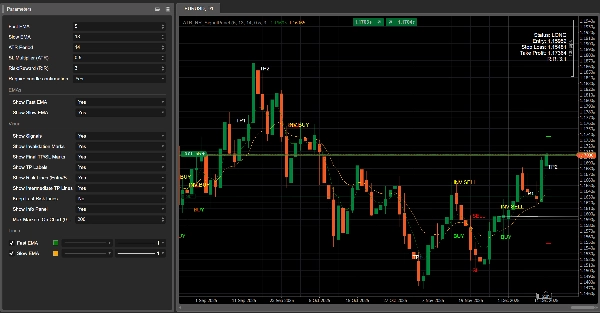
🧾 Show Info Panel
- What it does 🧠: Displays a compact status panel on the chart.
- Shows 📋: Status (LONG/SHORT/No Position), Entry, SL, TP, computed RR.
Summary
The indicator simulates virtual trades by setting entry price, stop loss, and take profit levels using Average True Range (ATR) for volatility-based risk sizing combined with a configurable risk-to-reward multiplier. It tracks intermediate take profit levels and monitors price action bar-by-bar to mark virtual trade outcomes without placing actual orders.
Key features include optional candle confirmation for signals, multi-instance support to run multiple configurations on the same chart, and visual clutter controls such as limiting markers and toggling display of EMAs, signals, and risk lines. An info panel provides a compact status overview of virtual positions. Parameters allow customization of EMA periods, ATR period, stop loss multiplier, and risk-reward ratio to adapt to different trading styles and market conditions.
Supported markets include Forex, indices, commodities, stocks, and cryptocurrencies, with symbols like GBPUSD, EURUSD, XAUUSD, NAS100, and BTCUSD among the tagged assets.
Customer reviews
5 | 100 % | |
4 | 0 % | |
3 | 0 % | |
2 | 0 % | |
1 | 0 % |


