
Descrizione
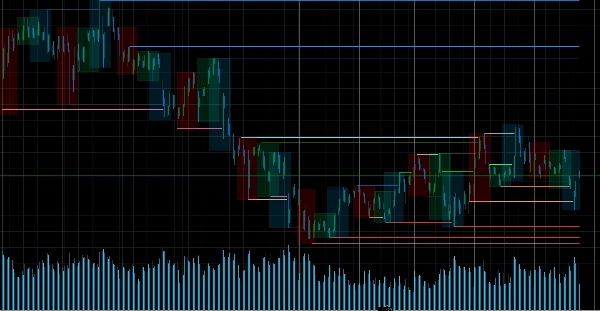
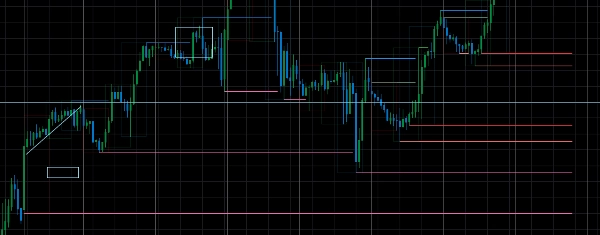
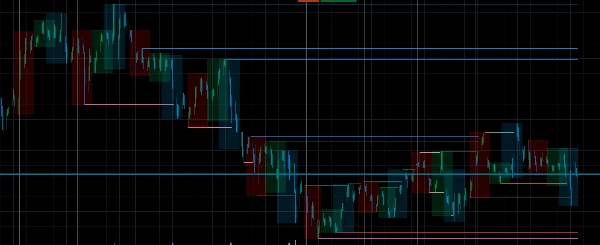
Con questo indicatore puoi visualizzare
- massimo/minimo giornaliero
- massimo/minimo della sessione (asia, londra, ny)
- riquadri della sessione (asia, londra, ny, anche riempiti)
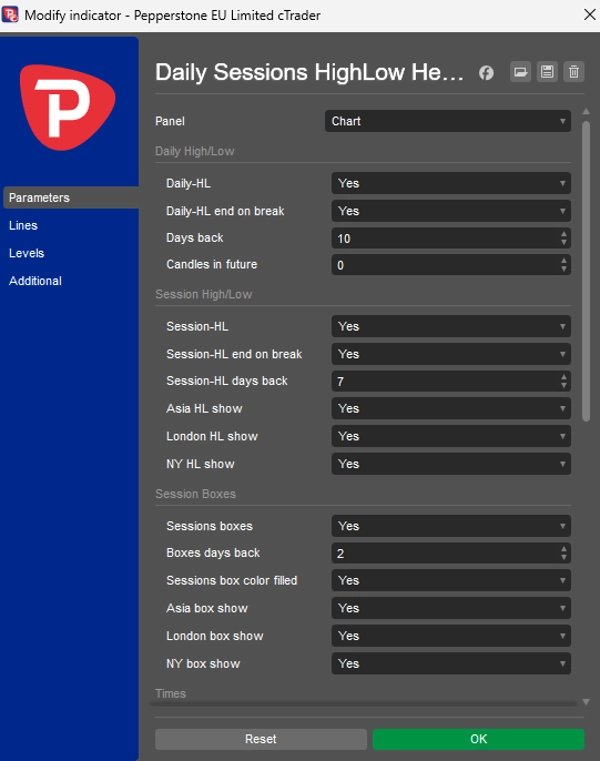
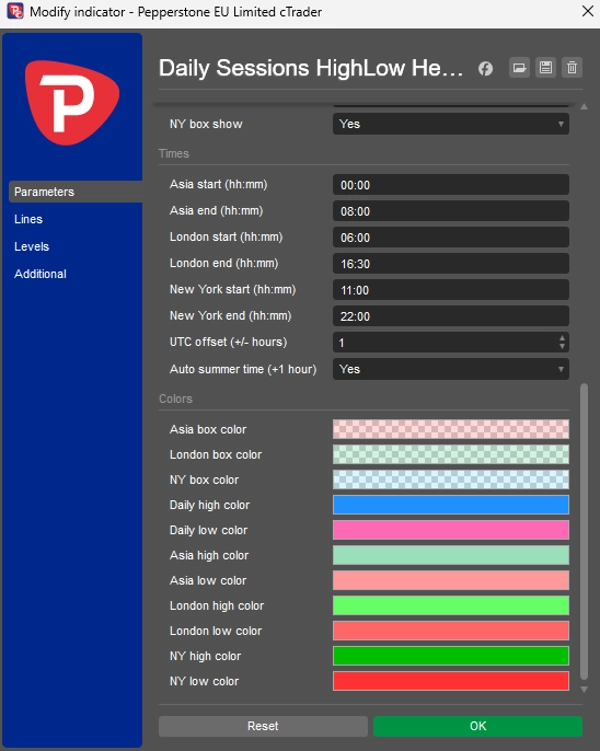
Configurazione
- mostra massimo/minimo giornaliero
- giorni indietro massimo/minimo giornaliero
- massimo/minimo giornaliero termina alla pausa
- massimo/minimo giornaliero più lungo
- mostra massimo/minimo della sessione
- giorni indietro massimo/minimo della sessione
- massimo/minimo della sessione termina alla pausa
- mostra riquadri della sessione
- giorni indietro riquadri
- riquadri riempiti
- orari delle sessioni
- offset UTC
- ora legale automatica
Impostazioni predefinite, attiva e avvia, presta attenzione al tuo fuso orario
qualsiasi domanda o richiesta, fammi sapere
Riepilogo
Recensioni dei clienti
5 | 50 % | |
4 | 0 % | |
3 | 0 % | |
2 | 0 % | |
1 | 50 % |


