

present
Registrati e ricevi uno sconto da $50 sul tuo primo acquisto
Trading product for Session Liquidity Map Pro Indicatore Premium/Discount  Supertrend, image 1
Session Liquidity Map Pro
Indicatore
Versione 1.0, Jul 2026
Windows, Mac
Trading product for Session Liquidity Map Pro Indicatore Premium/Discount  Supertrend, image 2
Trading product for Session Liquidity Map Pro Indicatore Premium/Discount  Supertrend, image 3
Trading product for Session Liquidity Map Pro Indicatore Premium/Discount  Supertrend, image 4
Trading product for Session Liquidity Map Pro Indicatore Premium/Discount  Supertrend, image 5

Descrizione

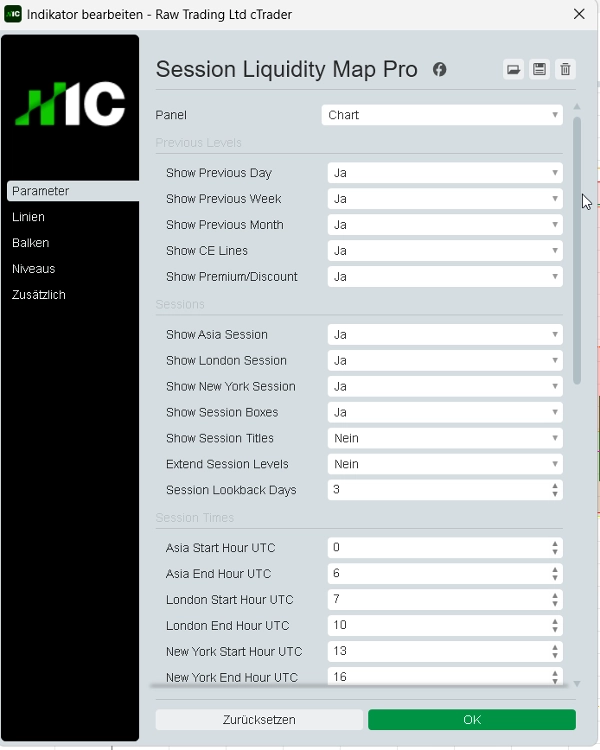
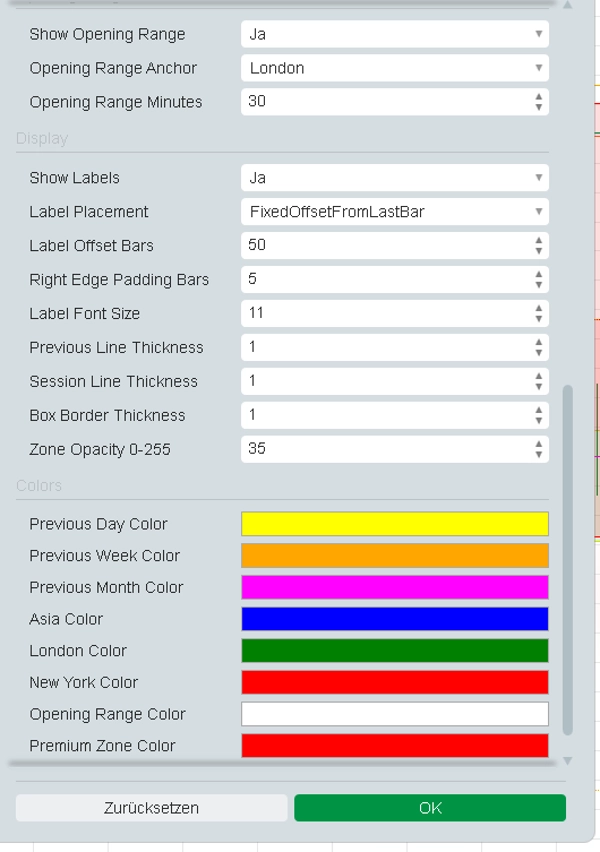
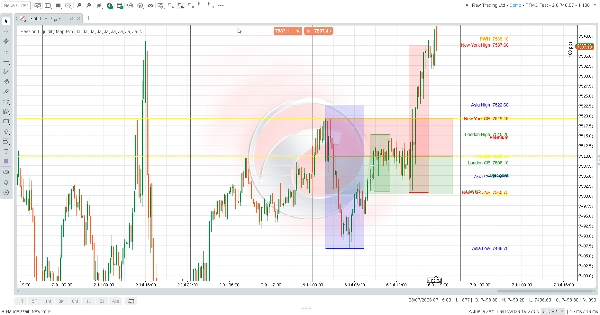
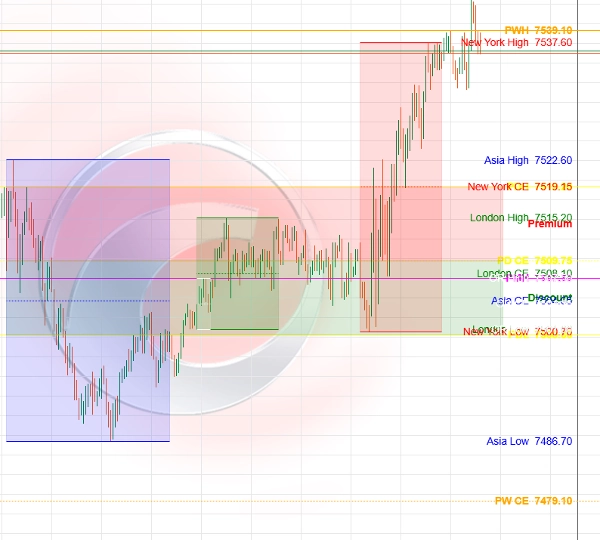
Session Liquidity Map Pro è un indicatore visivo per cTrader per l'analisi strutturata dell'azione del prezzo. Visualizza automaticamente i massimi/minimi del giorno, della settimana e del mese precedenti con livelli di equilibrio, intervalli delle sessioni Asia/Londra/New York, livelli dell'intervallo di apertura e zone di premio/sconto.


L'indicatore è progettato per la preparazione del grafico, l'analisi basata sulla liquidità, la revisione della struttura del mercato e la ricerca di backtesting. Non esegue operazioni, non fornisce segnali di acquisto/vendita e non richiede Accesso Completo.


Il trading comporta rischi. Le performance passate non garantiscono risultati futuri.

Riepilogo

Riepilogo AI
Session Liquidity Map Pro is a visual indicator for the cTrader platform designed to enhance structured price action analysis. It automatically maps key market data on your chart, including previous day, week, and month highs and lows, equilibrium levels, and session ranges for Asia, London, and New York. The indicator also highlights opening range levels and premium/discount zones, aiding in liquidity-based analysis and market structure review.

This tool supports chart preparation and backtesting research by visually presenting critical price levels and zones relevant to market participants. It does not execute trades or provide buy/sell signals and operates without requiring full access permissions. The indicator is categorized under market structure and provides visual outputs to assist traders in identifying liquidity sweeps, market structure shifts, key levels, and premium/discount areas.

Session Liquidity Map Pro is suitable for traders focusing on market structure concepts and price action analysis, offering a comprehensive overview of session dynamics and historical price points to inform trading decisions.
Profilo indicatore
Categoria indicatore
Struttura del mercato (SMC)
Tipo di output
Visualizzazione
Requisiti per i dati
Solo barre
Segnali supportati
Inversione
Rottura
Forza del trend
Livello raggiunto
Livello rotto
Intervallo di apertura della sessione

Recensioni dei clienti

0.0
Recensioni: 0
Recensioni dei clienti
Questo prodotto non ha ancora ricevuto recensioni. L'hai già provato? Fallo sapere agli altri per primo!

Discussioni

Domande frequenti

Premium/Discount
Supertrend
Key Levels
MSS
Liquidity Sweep
Market Structure
I prodotti disponibili tramite cTrader Store, inclusi bot di trading, indicatori e plugin, sono forniti da sviluppatori terzi e resi disponibili esclusivamente a scopo informativo e di accesso tecnico. cTrader Store non è un broker e non fornisce consulenze in materia di investimento, raccomandazioni individualizzate o garanzie di risultati futuri.

Altro da questo autore

Indicatore
SMC
Prop
+5
Automatically draws the Opening Range (High & Low) for Tokyo, London, and New York sessions. Configurable start times,
Indicatore
Liquidity Grab
Liquidity Sweep
+2
Visualizes accumulation ranges, manipulation sweeps and distribution phases on your cTrader chart.
Indicatore
BOS
Key Levels
+2
Maps bullish and bearish order block zones, CE levels and structure-based price action context.
Indicatore
MSS
Key Levels
+2
Maps equal highs, equal lows and active liquidity pools directly on your cTrader chart.
Indicatore
SMC
Prop
+12
Killzone, ICT, SMC, Session, Asia, London, New York, NY PM, Session High, Session Low, Smart Money, Order Flow, Trading
Indicatore
BOS
MSS
+3
Maps BOS, CHoCH, swing breaks and market structure shifts directly on your cTrader chart.
Indicatore
EMA
RSI
+2
Compact premium cTrader dashboard for market bias, sessions, premium/discount context, liquidity direction, ADR range an
cBot
ATR
EMA
+4
Professional Supply & Demand Execution Bot for cTrader. CS Apex Hunter Pro is a fully automated execution bot designed
7.6%
ROI
3.17
Fattore di profitto

Potrebbe interessarti anche

Indicatore
Prop
Forex
+14
Stochastic Momentum Index (SMI) for cTrader optional higher-timeframe source, and clear overbought/oversold levels.
Indicatore
Moving Average
An Indicator made for scalping. Shows you the Sniper movement on Chart with the colour signals.
Indicatore
Forex
BTCUSD
+4
🚀 HALF TREND Indicator - The Ultimate Trend Following System 🚀
Indicatore
Color-Based Market Pressure & Volatility Visualizer The Kandika Heatmap Indicator
Indicatore
AI
SMC
+9
Identifies market trends (-10 to +10) using HMA with volume confirmation. Includes customizable alerts.
Indicatore
Advanced customizable volume-profile indicator with buy/sell levels, delta analysis, multi-TF support and vivid gradient
Indicatore
VWAP
Forex
+12
Unlock VWAP in cTrader! Choose anchor periods, price sources, and display deviation bands with real-time tick updates.
Indicatore
ATR
Forex
+5
A powerful ATR-based indicator generating clear BUY/SELL signals. Features real-time alerts and customizable sensitivity
Indicatore
AI
ATR
+19
Market Cipher A
Indicatore
ATR
SMC
+17
Adaptive Swing-Anchored VWAP that tracks market structure shifts with precision and clarity.
Indicatore
AI
ATR
+26
MacD Custom Indicator-Multiple Time Frame
Indicatore
ATR
Volume
+4
This allows traders to see not just the trend, but whether the momentum itself is overextended.
Indicatore
BOS
Volume
+5
20/40/60-day IPDA lookback ranges, Premium/Discount/Equilibrium zones, and quarterly shift alerts — anchored to true dai
Indicatore
SMC
Prop
+14
Right-anchored cTrader Volume Profile with VAH/VAL/POC, LVZ, top volume+EMA, themes, and fast, readable visuals.
Indicatore
Key Levels
Support & Resistance
Draws a colored High/Low/Open/Close box for any custom time range you set — trade breakouts & retests.
Indicatore
ATR
EMA
+5
The indicator displays potential reversal zones (support/resistance) on the chart based on the average range (High–Low)
Indicatore
BOS
CHOCH
+3
Identifies HH, HL, LH, and LL swing points using fractals. Essential for Smart Money Concepts and price action.
Indicatore
ATR
MACD
+15
BrickAlgo TrendPulse is an advanced technical analysis tool that combines multiple indicators with filterin mechanisms.

Prezzo

4
Vendite
























