present
Registrati e ricevi uno sconto da $50 sul tuo primo acquisto
Trading product for Session Power Model Indicatore Liquidity Sweep Market Structure, image 1
Session Power Model
Indicatore
1 acquisti
Versione 1.0, Jul 2026
Windows, Mac
Trading product for Session Power Model Indicatore Liquidity Sweep Market Structure, image 2
Trading product for Session Power Model Indicatore Liquidity Sweep Market Structure, image 3
Trading product for Session Power Model Indicatore Liquidity Sweep Market Structure, image 4
Trading product for Session Power Model Indicatore Liquidity Sweep Market Structure, image 5

Descrizione

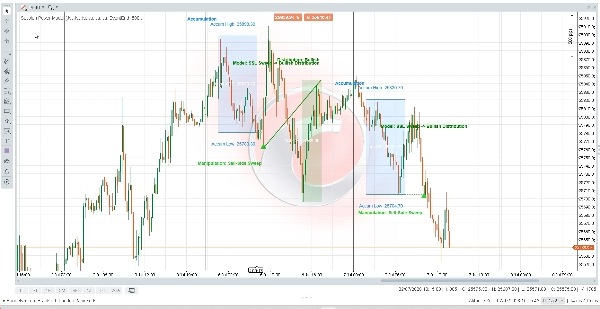
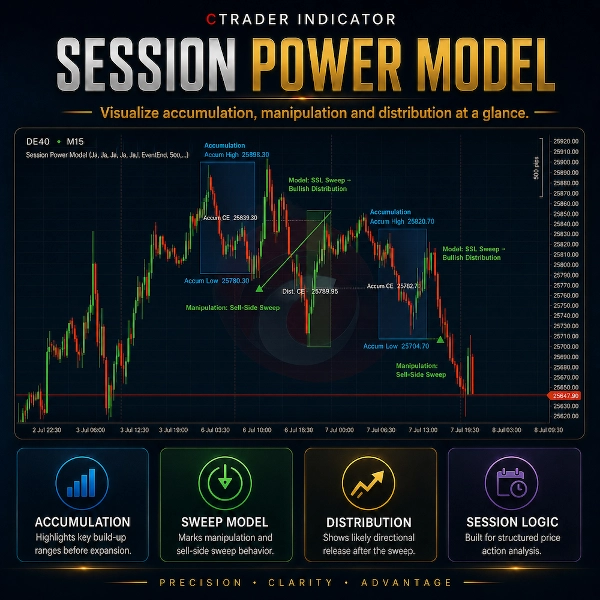
Session Power Model è un indicatore visivo per cTrader progettato per aiutare i trader ad analizzare il comportamento ricorrente delle sessioni direttamente sul grafico.


L'indicatore divide la giornata di trading in tre fasi configurabili: accumulo, manipolazione e distribuzione. Segna l'intervallo di accumulo, rileva potenziali sweep di liquidità durante la finestra di manipolazione e visualizza la successiva fase di distribuzione.


Il modello può identificare sweep dal lato vendita che portano a un contesto di distribuzione rialzista, sweep dal lato acquisto che portano a un contesto di distribuzione ribassista e giorni misti in cui entrambi i lati vengono sweepati.


Caratteristiche principali:

- Visualizzazione dell'intervallo di accumulo

- Rilevamento degli sweep di manipolazione

- Visualizzazione della fase di distribuzione rialzista e ribassista

- Linee CE della sessione

- Frecce di sweep

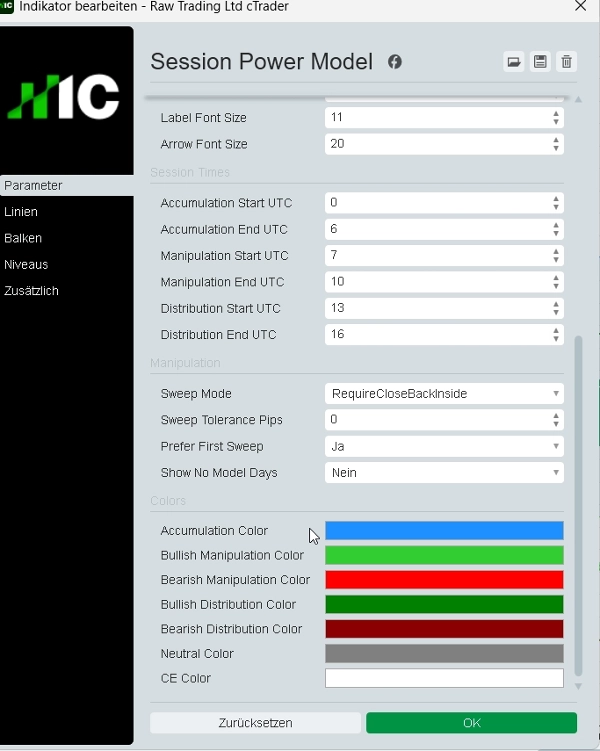
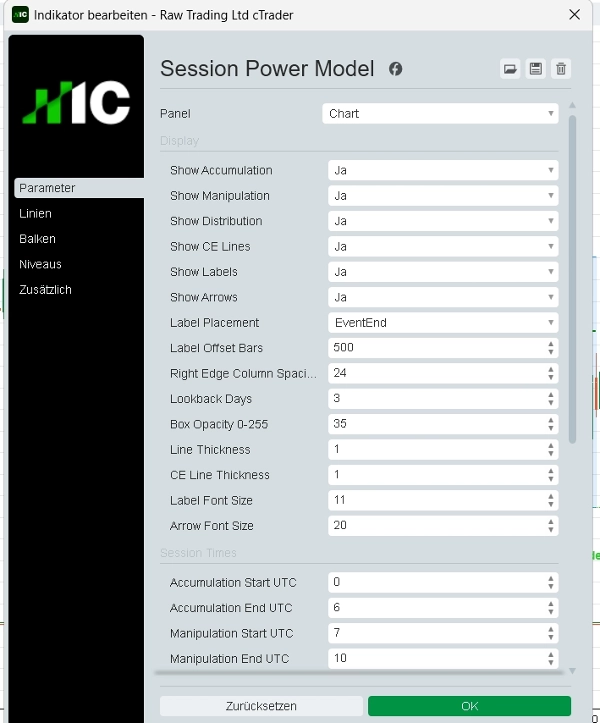
- Orari di sessione configurabili

- Giorni di lookback regolabili

- Posizionamento delle etichette sul bordo destro

- Sovrapposizione pulita sul grafico

- Colori personalizzati, opacità e impostazioni delle etichette

- Indicatore sicuro per lo store con diritti di accesso limitati


Session Power Model è progettato per l'analisi discrezionale dell'azione del prezzo, la revisione del grafico basata sulla liquidità, la ricerca sulle sessioni e la preparazione al backtesting.


Questo indicatore non è un robot di trading. Non esegue operazioni, non modifica ordini né fornisce segnali di acquisto/vendita garantiti. È solo uno strumento di visualizzazione del grafico e del contesto di mercato.


Il trading comporta rischi. Questo indicatore non fornisce consigli finanziari, raccomandazioni di investimento, probabilità statistiche o risultati di trading garantiti.

Riepilogo

Riepilogo AI
Session Power Model is a cTrader indicator that visually segments the trading day into three phases: accumulation, manipulation, and distribution. It highlights the accumulation range, detects liquidity sweeps during the manipulation phase, and displays bullish or bearish distribution phases on the chart. The indicator identifies sell-side sweeps leading to bullish distributions, buy-side sweeps leading to bearish distributions, and mixed scenarios involving both sides. Key features include configurable session times, adjustable lookback periods, session CE lines, sweep arrows, customizable colors and labels, and a clean chart overlay. Designed for discretionary price action analysis, liquidity-based chart review, session research, and backtesting preparation, this tool provides market context visualization without executing trades or offering trading signals. It supports analysis focused on market structure, liquidity sweeps, and support/resistance levels.
Profilo indicatore
Categoria indicatore
Struttura del mercato (SMC)
Tipo di output
Visualizzazione
Requisiti per i dati
Solo barre
Segnali supportati
Divergenza
Rottura
Inversione
Forza del trend

Recensioni dei clienti

0.0
Recensioni: 0
Recensioni dei clienti
Questo prodotto non ha ancora ricevuto recensioni. L'hai già provato? Fallo sapere agli altri per primo!

Discussioni

Domande frequenti

Liquidity Sweep
Market Structure
Liquidity Grab
Support & Resistance
I prodotti disponibili tramite cTrader Store, inclusi bot di trading, indicatori e plugin, sono forniti da sviluppatori terzi e resi disponibili esclusivamente a scopo informativo e di accesso tecnico. cTrader Store non è un broker e non fornisce consulenze in materia di investimento, raccomandazioni individualizzate o garanzie di risultati futuri.

Altro da questo autore

Indicatore
SMC
Prop
+5
Automatically draws the Opening Range (High & Low) for Tokyo, London, and New York sessions. Configurable start times,
Indicatore
BOS
Key Levels
+2
Maps bullish and bearish order block zones, CE levels and structure-based price action context.
Indicatore
MSS
Key Levels
+4
Maps session ranges, previous highs/lows, equilibrium and premium/discount zones on your cTrader chart.
Indicatore
MSS
Key Levels
+2
Maps equal highs, equal lows and active liquidity pools directly on your cTrader chart.
Indicatore
SMC
Prop
+12
Killzone, ICT, SMC, Session, Asia, London, New York, NY PM, Session High, Session Low, Smart Money, Order Flow, Trading
Indicatore
BOS
MSS
+3
Maps BOS, CHoCH, swing breaks and market structure shifts directly on your cTrader chart.
Indicatore
EMA
RSI
+2
Compact premium cTrader dashboard for market bias, sessions, premium/discount context, liquidity direction, ADR range an
cBot
ATR
EMA
+4
Professional Supply & Demand Execution Bot for cTrader. CS Apex Hunter Pro is a fully automated execution bot designed
7.6%
ROI
3.17
Fattore di profitto

Potrebbe interessarti anche

Indicatore
AI
ATR
+26
SR Commander — Multi Timeframe Edition. See where the big money draws the line. Trade on your timeframe. Think on theirs
Indicatore
BTCUSD
EURUSD
+7
Pure Market Structure, Catching the Algo of Institutional move, Stay in the Game !! & know what's gonna happen Next.
Indicatore
ATR
Prop
+5
Anchor volume profiles to pivots with POC, VAH, VAL and real-time insights for clearer trade decisions.
Indicatore
RSI
SMC
+17
Turn WaveTrend Cross into a BTC profit machine precise buy sell signals, smart momentum edge, no lag trading system
Indicatore
SMC
Forex
+5
MMXM Structure by LudwigICT – Professional Market Structure Mapping Tool
Indicatore
Prop
Forex
+3
Price Change Bundle 3-in-1 Levels • Bars • Histogram. Secret of Price Change
Indicatore
RSI
MACD
+5
LudwigICT – Digital Root & IDR (cTrader Automate)
Indicatore
ADX
ATR
+3
Nine live gauges turn raw market data into one clear dashboard. Trend, volume, volatility - at a glance, any symbol.
Indicatore
AI
Prop
+16
Pro trading dashboard: WVAP analysis + Volume Profile + Neural AI tracking + News alerts. All-in-one tool!
Indicatore
Signal
Order Flow Market Depth Pro | Footprint & DOM
Indicatore
MSS
Volume
+3
Rejection-based volume profile with tiered heat zones, POC levels and a fully draggable anchor on cTrader.
Indicatore
ATR
EMA
+5
Multi-factor volatility squeeze detector, dual-trend scoring & breakout validation dashboard. No repaint.
Indicatore
BOS
Flag
+5
Detect consolidation zones. Heatmap shows activity density. Body vs wick scoring reveals true strength zones.
Indicatore
BOS
CHOCH
+3
Smart Money Concepts Pro v5.1 for cTrader is a structural market analysis indicator that identifies swings, BOS, CHoC
Indicatore
BOS
Fibonacci
+4
Market structure, liquidity sweeps, BOS/CHoCH, smart zones and BUY/SELL setups with Entry, SL and TP.
Indicatore
Grid
Prop
+5
Logarithmic Framework by LudwigICT
Indicatore
Double Top
Key Levels
+5
Indicator acts as a dynamic target identification engine based on SMC and ICT. Detects HTF Bias and Confluence liquidity
Indicatore
RSI
Breakout
+1
📊 Liquidation Map: Potential areas where highly leveraged investors might face liquidations.

Prezzo

4
Vendite