present
ลงทะเบียนและรับส่วนลด $50 สำหรับการซื้อครั้งแรกของคุณ
ตั้งแต่ 26/05/2025
545.64M
ปริมาณการเทรด
65.87K
Pips ที่ได้กำไร
17
การขาย
1.81K
ติดตั้งฟรี

คำอธิบาย

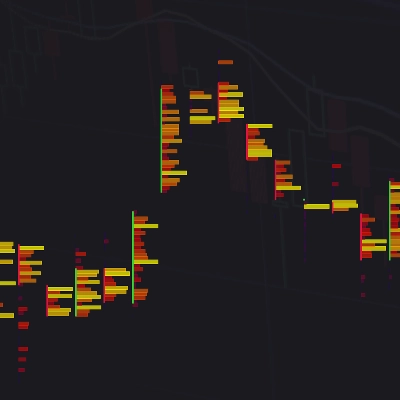
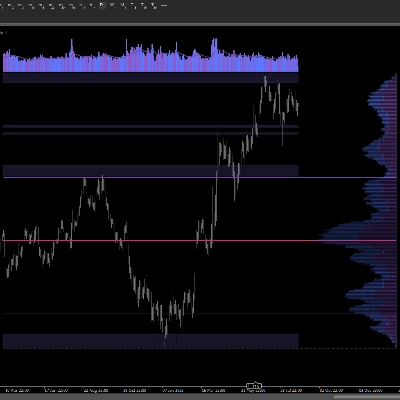
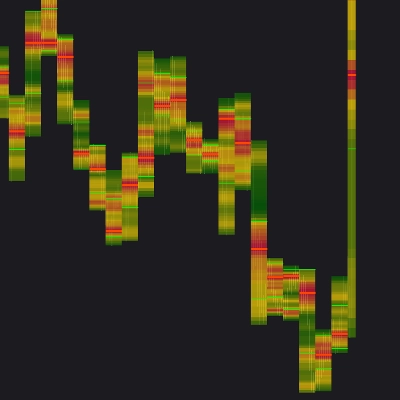
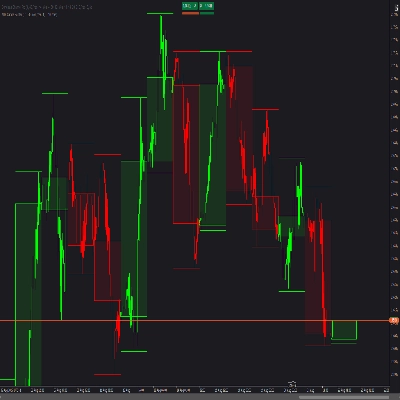
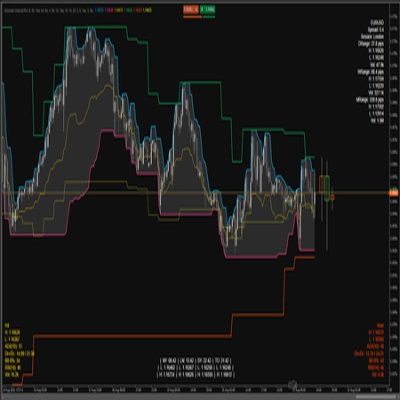
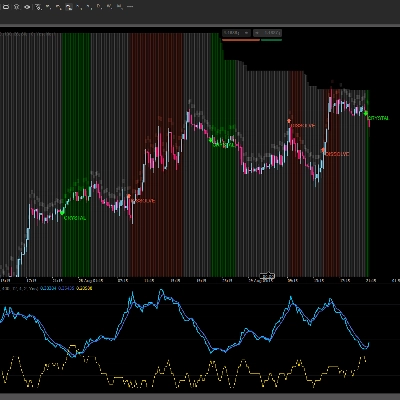
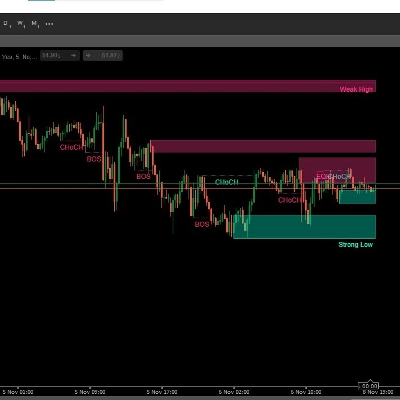
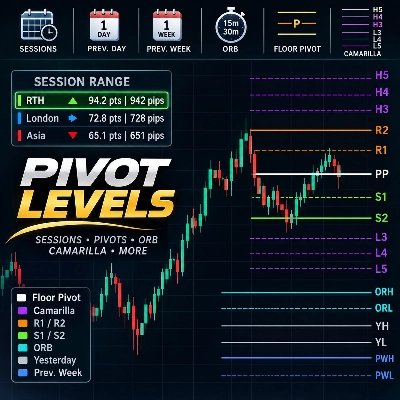
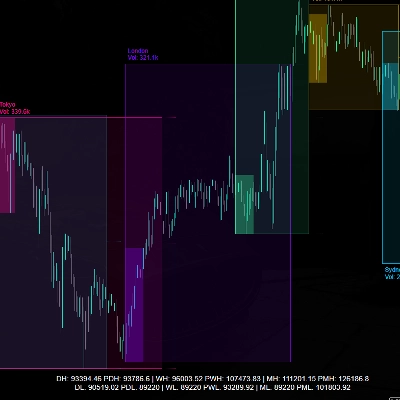
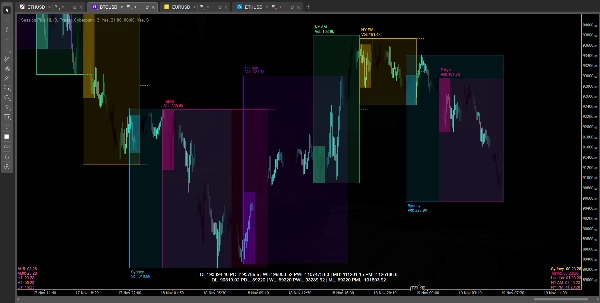
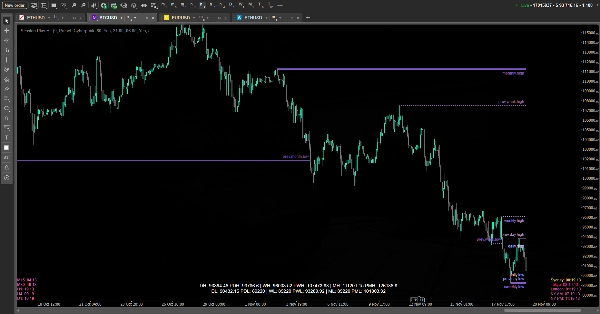
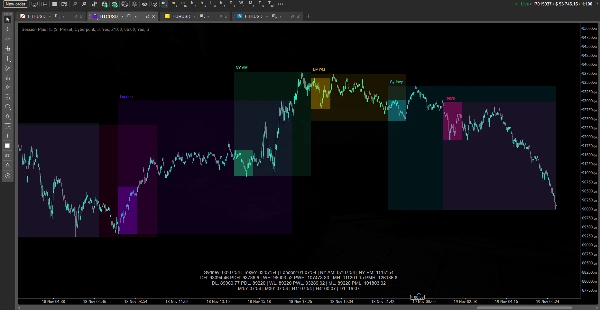
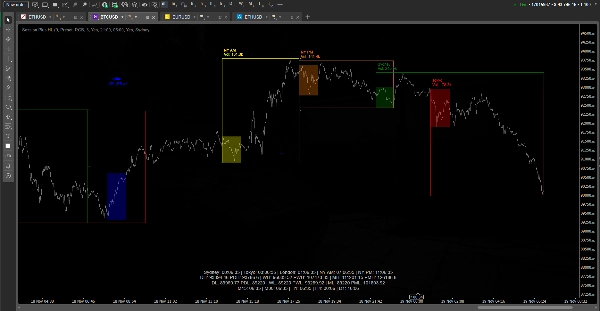
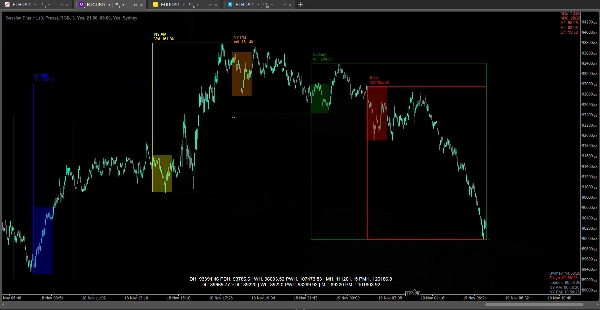
ตัวบ่งชี้นี้ถูกออกแบบมาเพื่อแสดงโครงสร้างตลาดและบริบทตามเวลาสำหรับผู้ซื้อขายภายในวัน โดยจะวางกรอบช่วงการซื้อขายหลัก (ซิดนีย์ โตเกียว ลอนดอน นิวยอร์ก ช่วงเช้า/บ่าย) อัตโนมัติบนกราฟ แสดงระดับสูง/ต่ำและระดับกลางที่เลือกได้ และสามารถเน้นช่วง Initial Balance (IB) ภายในแต่ละช่วงการซื้อขายได้ นอกจากนี้ยังวาดระดับอ้างอิงสำคัญจากกรอบเวลาที่สูงกว่า — สูงและต่ำของวัน/สัปดาห์/เดือนปัจจุบันและก่อนหน้า — และแสดงทั้งในรูปแบบเส้นบนกราฟและแดชบอร์ดขนาดกะทัดรัด เพื่อให้คุณเห็นตำแหน่งราคาที่สัมพันธ์กับกลุ่มสภาพคล่องล่าสุดเสมอ

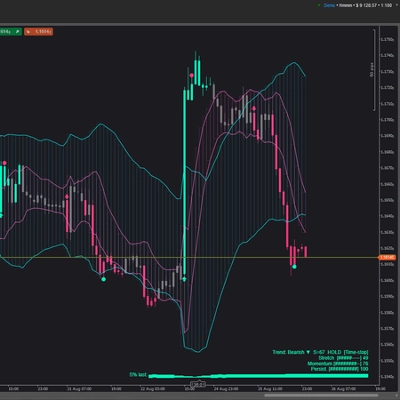
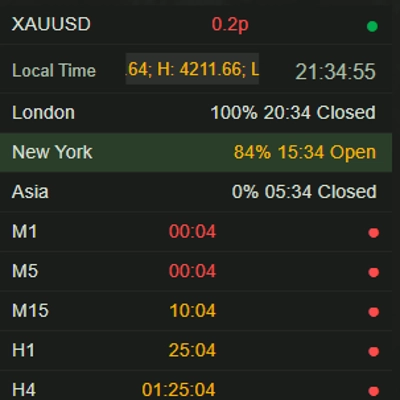
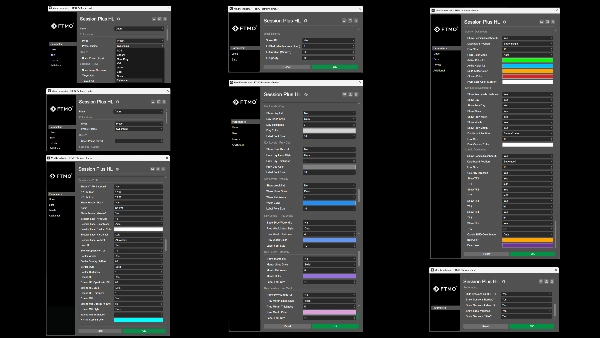
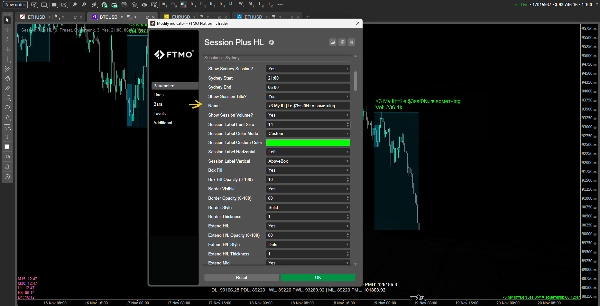
นอกจากนี้ ตัวบ่งชี้ยังมี HUD หลายแบบ: แดชบอร์ดช่วงการซื้อขายที่แสดงเวลาที่เหลือจนกว่าจะเปิดหรือปิดแต่ละช่วง, แดชบอร์ดระดับสำคัญที่สรุปค่าระดับสูง/ต่ำรายวัน/รายสัปดาห์/รายเดือนทั้งหมด, และแดชบอร์ดแท่งเทียนที่แสดงเวลาที่เหลือในแท่งเทียนบนกรอบเวลาที่สูงกว่าหลายระดับและสถานะกระทิง/หมีของแท่งเทียนเหล่านั้น ภาพทั้งหมดสามารถปรับธีมได้ (ตั้งค่าสีล่วงหน้าหรือสีที่กำหนดเอง), ปรับแต่งเพื่อประสิทธิภาพ (ซ่อนช่วงการซื้อขายบนกรอบเวลาที่สูงกว่า, ควบคุมเส้นสั้นแทนการขยายแบบไดนามิกหนักๆ) และถูกออกแบบมาเพื่อสนับสนุนการวิเคราะห์การกวาดสภาพคล่อง ช่วงการซื้อขาย และการจับเวลาที่ไม่ทำให้กราฟรกหรือช้า

สรุป

สรุปโดย AI
Session Plus HL is an intraday trading indicator that visualizes market structure and time-based context by automatically plotting key trading sessions—Sydney, Tokyo, London, New York AM/PM—as boxes on the chart. It displays each session's high, low, and optional mid levels, and can highlight the Initial Balance (IB) range within sessions. The indicator also draws key reference levels from higher timeframes, including current and previous day, week, and month highs and lows, shown as lines on the chart and summarized in a compact dashboard. Additional HUDs include a session dashboard indicating time until session open or close, a key levels dashboard summarizing daily/weekly/monthly highs and lows, and a candle dashboard showing remaining time and bullish/bearish status for multiple higher timeframe candles. Visual elements are customizable with color presets or custom colors and can be optimized for performance by controlling session visibility and line extensions. The tool supports analysis of liquidity sweeps, session ranges, and timing across various markets including Forex, indices, commodities, stocks, and cryptocurrencies such as BTCUSD, EURUSD, GBPUSD, and XAUUSD.
โปรไฟล์อินดิเคเตอร์

การสนทนา

รีวิวจากลูกค้า

3.5
รีวิว: 2
5
0 %
4
50 %
3
50 %
2
0 %
1
0 %
รีวิวจากลูกค้า
November 21, 2025
Not a hands off answer, but it has a clear role. It helps with smart money style analysis, while the weak spot is that zones still need manual validation.
November 20, 2025
ngl, this one makes sense if you are not trying to yolo every signal. Better keeping it on demo first and see how it behaves when liquidity moves gets messy. The warning sign is when the trade plan starts feeling forced.705 caution area.

คำถามที่พบบ่อย

BTCUSD
Forex
Signal
Breakout
Indices
EURUSD
Commodities
GBPUSD
NZDUSD
Prop
ZigZag
Scalping
Supertrend
Fair Value Gap
SMC
Crypto
Stocks
XAUUSD
NAS100
ATR
USDJPY
VWAP
ผลิตภัณฑ์ที่มีให้บริการผ่าน cTrader Store รวมถึงบอทการเทรด อินดิเคเตอร์ และปลั๊กอิน มีให้บริการโดยนักพัฒนาบุคคลที่สามและมีไว้เพื่อวัตถุประสงค์ในการเข้าถึงข้อมูลและทางเทคนิคเท่านั้น cTrader Store ไม่ใช่โบรกเกอร์และไม่ได้ให้คำแนะนำการลงทุน คำแนะนำส่วนบุคคล หรือการรับประกันผลการดำเนินงานในอนาคต

ราคา

ตั้งแต่ 26/05/2025
545.64M
ปริมาณการเทรด
65.87K
Pips ที่ได้กำไร
17
การขาย
1.81K
ติดตั้งฟรี