
Side Volume Profile
Indicatore
11 acquisti
Versione 1.0, Aug 2025
Windows, Mac
4.3
Recensioni: 3
Da 26/05/2025
385.04M
Volume negoziato
60.66K
Profitto in pip
14
Vendite
1.4K
Installazioni gratuite
Descrizione
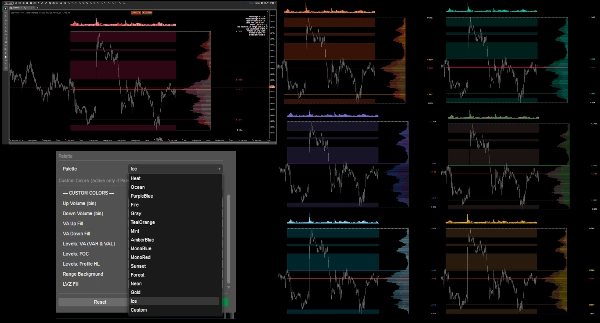
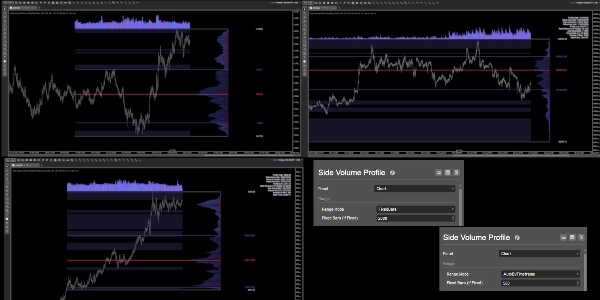
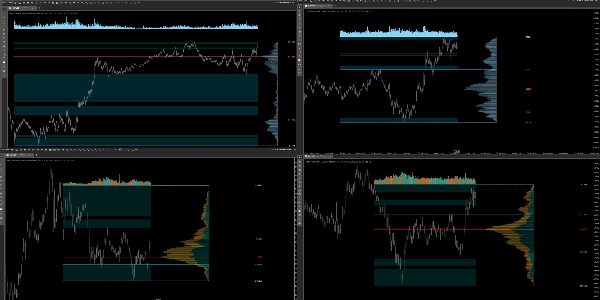
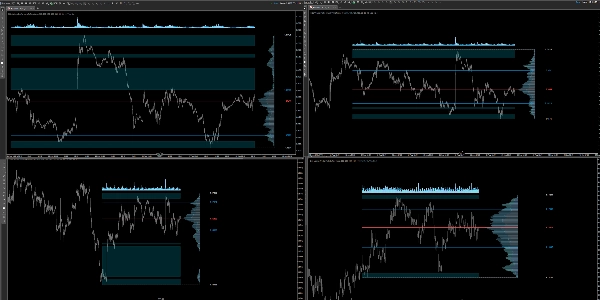
Un Volume Profile sul lato destro, sempre ancorato alle ultime barre e che non salta quando si sposta il grafico. Calcola il volume per prezzo su un intervallo scelto (automatico per intervallo temporale o un numero fisso di barre), mostra POC, VAH/VAL, i limiti del profilo (Massimo/Minimo), evidenzia le zone a basso volume (LVZ) e disegna un istogramma del volume con EMA sopra l'intervallo (offset in pips). Include un pannello statistico in alto a destra, diverse palette ad alto contrasto più colori personalizzati, opacità globale dei bin, controlli di larghezza/offset e spessore/stile per linea. Progettato per leggibilità e prestazioni.
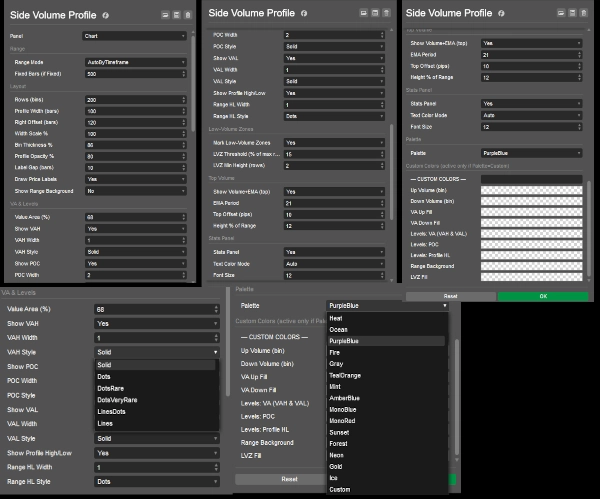
- Intervallo: AutoByTimeframe o FixedBars.
- Layout: Righe (bin), Larghezza Profilo / Scala Larghezza, Offset a Destra, Spessore Bin, Spazio Etichetta, opacità profilo; sfondo intervallo opzionale.
- VA & Livelli: Percentuale Area di Valore, attiva/disattiva VAH/POC/VAL, larghezza e stile linea per livello; Massimo/Minimo profilo.
- Zone a Basso Volume: Soglia (% della riga massima) e altezza minima (righe).
- Volume Massimo: Periodo EMA, altezza (% dell'intervallo), offset predefinito 10 pips.
- Palette/Personalizzato: Scegli un tema o imposta i tuoi colori (VAH = VAL).
- Pannello Statistiche: Attiva/disattiva, dimensione del font
Documentazione dell'indicatore
Riepilogo
Riepilogo AI
Side Volume Profile is a right-anchored volume profile indicator designed for cTrader that displays volume-by-price data over a selectable range, either automatically by timeframe or a fixed number of bars. It visualizes key volume levels including Point of Control (POC), Value Area High (VAH), Value Area Low (VAL), and profile bounds (high/low). The indicator highlights low-volume zones (LVZ) based on configurable thresholds and minimum heights. It also features a volume histogram with an exponential moving average (EMA) offset in pips above the profile range.
Users can customize the layout with controls for row bins, profile width and scale, right offset, bin thickness, label gaps, and opacity. Line widths and styles for VAH, POC, VAL, and profile bounds are adjustable. Multiple high-contrast color palettes and custom color options are available. A toggleable top-right statistics panel provides summary data with adjustable font size.
The indicator supports various markets including Forex, indices, commodities, cryptocurrencies, and stocks, with tags referencing symbols like BTCUSD, EURUSD, GBPUSD, XAUUSD, NAS100, and USDJPY. It is built for readability and performance, maintaining a stable position on the chart without shifting when panning.
Profilo indicatore
Recensioni dei clienti
4.3
Recensioni: 3
5 | 33 % | |
4 | 67 % | |
3 | 0 % | |
2 | 0 % | |
1 | 0 % |
Recensioni dei clienti
Discussioni
Domande frequenti
BTCUSD
Forex
Indices
EURUSD
Commodities
GBPUSD
NZDUSD
Prop
Fair Value Gap
SMC
Crypto
Stocks
XAUUSD
NAS100
USDJPY
VWAP
I prodotti disponibili tramite cTrader Store, inclusi bot di trading, indicatori e plugin, sono forniti da sviluppatori terzi e resi disponibili esclusivamente a scopo informativo e di accesso tecnico. cTrader Store non è un broker e non fornisce consulenze in materia di investimento, raccomandazioni individualizzate o garanzie di risultati futuri.


Prezzo
Da 26/05/2025
385.04M
Volume negoziato
60.66K
Profitto in pip
14
Vendite
1.4K
Installazioni gratuite