
Opis
Mapa Korelacji – Twoje Niezbędne Narzędzie do Analizy Rynku
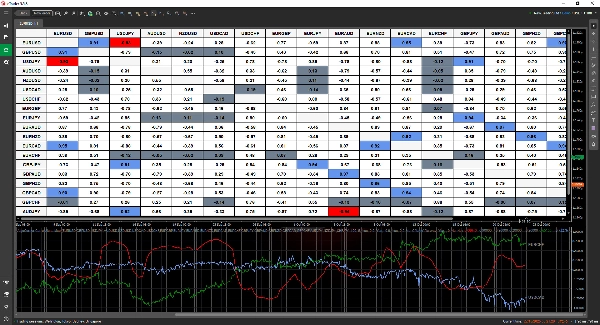
Mapa Korelacji to potężny, a zarazem intuicyjny wskaźnik, który pomaga szybko odkrywać zależności między aktywami. Dzięki czytelnemu formatowi tabeli możesz błyskawicznie zauważyć korelacje i podejmować bardziej świadome decyzje handlowe.
✅ Dostosuj swoją analizę – Wybierz i porównaj tyle par handlowych, ile pozwala Twoja platforma.
✅ Elastyczne ramy czasowe – Analizuj korelacje w dowolnym przedziale czasowym, dopasowując je do swojej strategii.
✅ Przejrzysty i elastyczny wyświetlacz – Wybierz format dziesiętny (-1 do 1) lub procentowy (-100% do 100%).
✅ Inteligentne podświetlanie – Łatwo identyfikuj silne i słabe korelacje dzięki konfigurowalnemu kodowaniu kolorów.
✅ Alerty w czasie rzeczywistym – Bądź na bieżąco dzięki powiadomieniom o znaczących zmianach wartości korelacji.
✅ Interaktywne dane – Kliknij dowolną komórkę, aby śledzić, jak korelacje zmieniają się w czasie.
✅ Ciągłe ulepszenia – Korzystaj z przyszłych aktualizacji bez dodatkowych kosztów.
Odkryj kluczowe zależności rynkowe i udoskonal swoją strategię handlową dzięki Mapie Korelacji! 🚀
Podsumowanie
Opinie klientów
5 | 67 % | |
4 | 33 % | |
3 | 0 % | |
2 | 0 % | |
1 | 0 % |


