
Beschreibung
Was ist die Coppock-Kurve?
Die Coppock-Kurve ist ein langfristiger Momentum-Indikator, der ursprünglich entwickelt wurde, um große Markttiefs im S&P 500 zu identifizieren. Sie wurde 1962 vom Ökonomen Edwin Coppock erstellt, der von der Episkopalkirche beauftragt wurde, risikoarme Kaufgelegenheiten für deren Stiftung zu finden.
Einfach ausgedrückt ist es ein trendfolgender Oszillator, der anzeigt, wann ein Bärenmarkt wahrscheinlich seinen Tiefpunkt erreicht hat und ein neuer Bullenmarkt beginnt.
Die „Geheime Zutat“ (Wie es funktioniert)
Im Gegensatz zu vielen Indikatoren, die unruhig und reaktiv sind, ist die Coppock-Kurve bewusst langsam. Sie wird berechnet, indem ein gewichteter gleitender Durchschnitt (WMA) der Summe von zwei verschiedenen Änderungsraten (ROC) genommen wird.
Coppock = WMA(10) von (ROC(14) + ROC(11))
Die Logik:
Sie misst die Geschwindigkeit, mit der sich das Preis-Momentum über lange Zeiträume (normalerweise 11 und 14 Monate) verändert. Durch das Glätten dieser Daten mit einem gewichteten Durchschnitt filtert sie nahezu allen kurzfristigen Marktrauschen heraus.
Interessante Tatsache:
Coppock soll Bischöfe gefragt haben, wie lange es dauert, bis eine Person den Verlust eines geliebten Menschen überwunden hat. Sie antworteten „11 bis 14 Monate“. Er übertrug diese Zeiträume auf den Markt und nahm an, dass die Marktpsychologie einem ähnlichen Zyklus von Trauer und Erholung folgt.
Warum ist sie nützlich?
Trader und Investoren schätzen die Coppock-Kurve aus drei Hauptgründen:
- Sie filtert das Rauschen: Da sie traditionell auf monatlichen Zeitrahmen berechnet wird, ignoriert sie die tägliche oder sogar wöchentliche Volatilität. Sie löst nicht oft aus, aber wenn, dann meist mit Bedeutung.
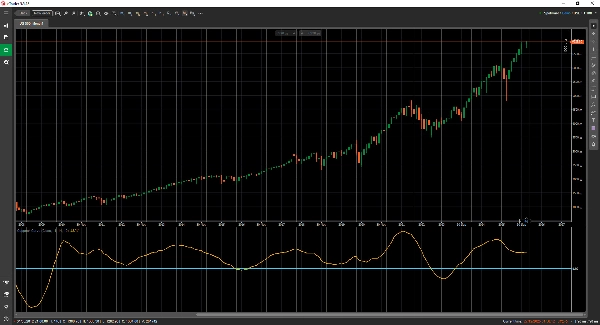
- Klare Kaufsignale: Das Signal ist binär und leicht zu lesen. Ein „Kauf“-Signal wird generiert, wenn die Kurve unter der Nulllinie liegt und nach oben dreht (zu steigen beginnt).
- Psychologischer Anker: Sie verhindert, dass man versucht, ein „fallendes Messer zu fangen“. Sie zwingt dazu, zu warten, bis sich das Momentum mathematisch von negativ zu positiv verschoben hat, bevor man eine Position eingeht.
Wann man sie verwendet
- Am besten für: Langfristige Investitionen, Altersvorsorgeallokationen und die Identifikation des Beginns eines neuen Bullenmarktes.
- Nicht geeignet für: Daytrading oder Leerverkäufe. Sie wurde nicht entwickelt, um Verkaufssignale oder Markthochs zu identifizieren.


