
Penerangan
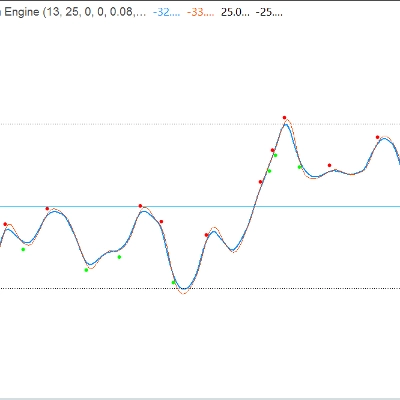
Enjin Pulse Momentum (PME) adalah osilator momentum adaptif maju dengan pembetulan kelewatan terbina dalam dan penapis konfluens 5-syarat. Ia mempercepatkan dalam tren, melambatkan dalam bunyi bising, dan hanya menunjukkan isyarat yang berbaloi diambil. Berfungsi pada Forex, indeks, emas, kripto, dan banyak lagi — terus dari kotak.
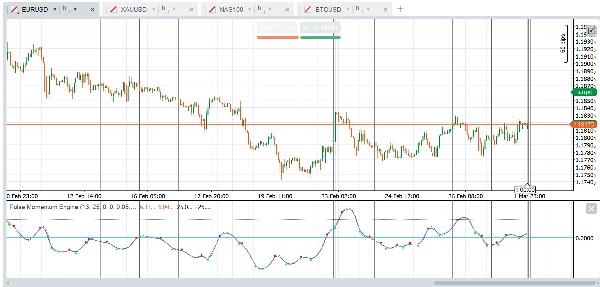
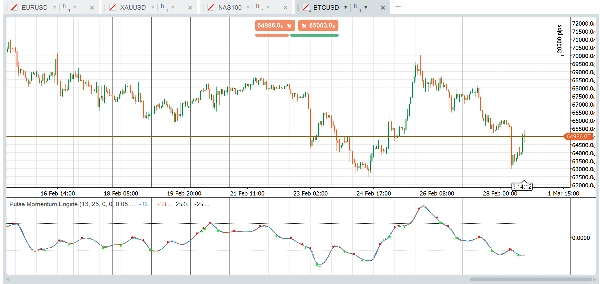
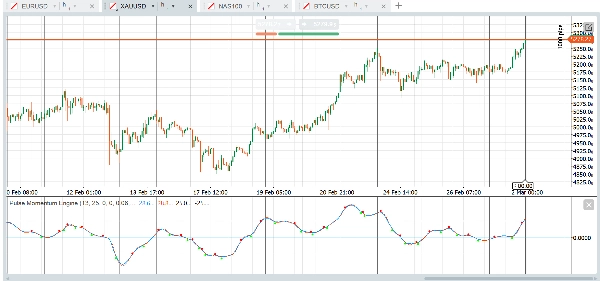
Penunjuk dipaparkan sebagai osilator sub-tetingkap dengan Garis Pulse utama, pilihan Garis Isyarat, tahap Jual Beli Berlebihan tetap, dan pilihan anak panah silang ditapis oleh sistem konfluens pelbagai syarat.
Kumpulan Parameter:
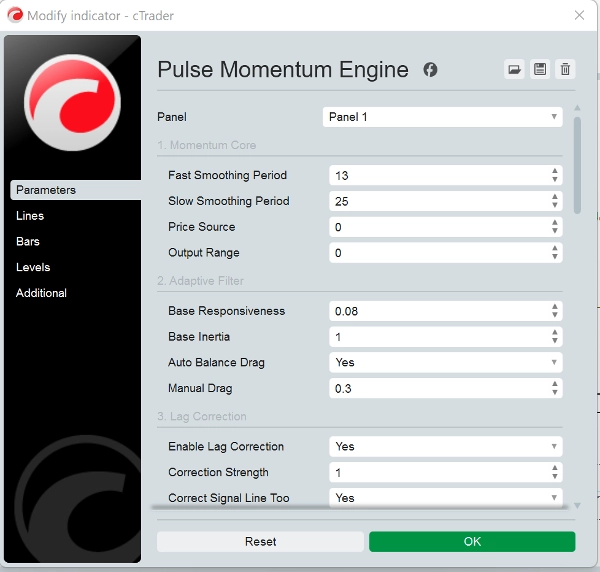
- Teras Momentum: Mengawal pengiraan momentum asas. Julat Output Lalai adalah berpusat pada 0. Apabila menggunakan Julat Output = 1 (Dialihkan), laraskan tahap OB/OS dengan sewajarnya (contohnya, OB = 70, OS = 30)
- Penapis Adaptif: Mengawal bagaimana penapis mengesan isyarat momentum. Respons Asas (0.08) menentukan seberapa cepat penapis bertindak balas terhadap perubahan momentum. Lebih tinggi = lebih cepat tetapi lebih bising. Inersia Asas (1.0) menentukan rintangan terhadap perubahan mendadak. Lebih tinggi = output lebih lancar tetapi lebih kelewatan. Seretan Imbangan Auto (Benar) secara automatik mengira seretan optimum untuk mengelakkan gegaran/osilasi. Disyorkan untuk dibiarkan diaktifkan. Seretan Manual (0.3) adalah pekali seretan manual apabila Imbangan Auto dimatikan. Lebih tinggi = lebih redaman.
- Pembetulan Kelewatan: Mengurangkan kelewatan semula jadi penapis adaptif menggunakan maklum balas ralat dua laluan.
- Penjejakan Dinamik: Membuat penapis menyesuaikan tingkah lakunya berdasarkan keadaan pasaran.
- Enjin Adaptasi: Mengawal mekanisme adaptasi keseluruhan.
- Garis Isyarat: Garis rujukan lebih perlahan yang digunakan untuk isyarat berasaskan silang.
- Anak Panah Silang: Penanda visual di titik silang garis utama/isyarat. Nota: Tidak Melukis Semula: Apabila "Perlukan Bar Disahkan" adalah Benar (lalai), isyarat silang hanya muncul selepas bar ditutup dan tidak akan hilang. Tetapkan kepada Salah hanya jika anda memerlukan amaran masa nyata dan faham isyarat mungkin berubah sebelum bar ditutup.
- Penapis Konfluens: Memerlukan pelbagai syarat bersetuju sebelum menunjukkan anak panah silang. Mengurangkan isyarat palsu dengan ketara.
- Tahap Tetap: Garis rujukan jual beli berlebihan yang mudah dan tetap. Konservatif (kurang isyarat): OB = 40, OS = -40 (berpusat) atau OB = 70, OS = 30 (dialihkan). Agresif (lebih isyarat): OB = 15, OS = -15 (berpusat) atau OB = 60, OS = 40 (dialihkan).
- Prestasi: Maksimum Bar untuk Kira ditetapkan kepada 0. 0 = kira semua sejarah yang tersedia. Tetapkan kepada 5000-10000 pada carta sangat panjang untuk mengurangkan beban CPU.
Penggunaan Asas
- Arah Tren: Apabila Garis Pulse (biru) berada di atas sifar dan menaik, momentum adalah bullish. Di bawah sifar dan menurun menunjukkan momentum bearish.
- Isyarat Silang: Satu isyarat bullish berlaku apabila Garis Pulse melintasi di atas Garis Isyarat (anak panah hijau). Satu isyarat bearish berlaku apabila ia melintasi di bawah (anak panah merah).
- Zon Jual Beli Berlebihan:
-
- Garis Pulse di atas tahap OB → pasaran mungkin terlalu melampau ke atas. Cari silang bearish sebagai isyarat pembalikan potensi.
- Garis Pulse di bawah tahap OS → pasaran mungkin terlalu jual. Cari silang bullish sebagai isyarat pembalikan potensi.
- Silang yang berlaku di zon neutral (antara OB dan OS) biasanya adalah isyarat mengikuti tren.
Strategi Penapis Konfluens
Konfigurasi lalai memerlukan 3 daripada 5 syarat untuk mengesahkan silang. Ini mengurangkan isyarat palsu dengan ketara. Anda boleh:
- Tingkatkan Syarat Minimum kepada 4-5 untuk isyarat yang kurang tetapi berkualiti tinggi
- Kurangkan Syarat Minimum kepada 1-2 untuk lebih banyak isyarat dengan kualiti individu yang lebih rendah
- Nyahaktifkan penapis individu untuk menyesuaikan pengesahan yang penting untuk strategi anda
Aset & Pasaran Disyorkan
Pasangan Forex Utama- EUR/USD, GBP/USD, USD/JPY, AUD/USD (Kecairan tinggi menghasilkan ayunan momentum yang bersih. Penapis adaptif mengendalikan turun naik sesi yang berbeza dengan berkesan)
Forex Crosses - EUR/GBP, GBP/JPY, AUD/NZD (Sering menunjukkan tingkah laku tren yang lebih kuat, yang dimanfaatkan dengan baik oleh penapis konfluens)
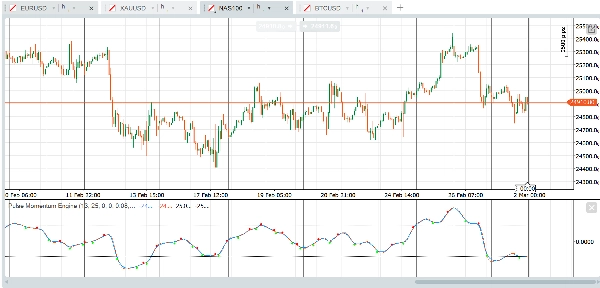
Indeks Saham - US30, NAS100, SPX500, GER40 (Fasa tren berterusan selaras baik dengan penapis adaptif. Pembetulan kelewatan menangkap breakout awal)
Emas (XAU/USD) - Ayunan momentum panjang dan fasa tren jelas sesuai dengan reka bentuk penapis.
Minyak Mentah - WTI, Brent (Ketahanan momentum yang kuat)
Saham Kap Besar - AAPL, MSFT, AMZN, TSLA (Penyertaan institusi menghasilkan tanda momentum yang bersih)
Kripto Utama - BTC/USD, ETH/USD (Kecenderungan tren yang kuat. Tingkatkan Responsif kepada 0.10 - 0.15 untuk kitaran kripto yang lebih pantas).
Kurang Sesuai untuk Instrumen Tidak Cecair (Lonjakan rawak diperbesarkan sebagai isyarat palsu) dan pasangan julat ketat (Penunjuk memberikan maklumat yang sedikit boleh digunakan).
Berkenaan dengan jangka masa, tetapan lalai dibuat untuk berfungsi dengan carta berasaskan masa satu jam terus dari kotak tetapi jangka masa dan jenis carta lain seperti renko, julat, tik juga berfungsi dengan baik. Platform dan Penunjuk adalah milik anda untuk bereksperimen mencari tetapan sesuai untuk strategi anda. Berikut adalah contoh pratetap cepat yang boleh anda cuba:
Pratetap Mula Cepat
Forex Utama — Sedia Terus Dari Kotak
Tetapan lalai dioptimumkan untuk pasangan forex utama pada jangka masa H1. Tiada perubahan diperlukan. Cuma gunakan penunjuk dan tetapkan tahap Jual Berlebihan anda kepada 25 dan tahap Beli Berlebihan kepada -25.
Emas & Minyak — Sedikit Lebih Responsif
Untuk emas (XAU/USD) dan minyak mentah, tingkatkan Respons Asas kepada 0.10 untuk menangkap ayunan momentum ciri mereka dengan lebih baik. Lebarkan sedikit tahap OB/OS kepada 30 dan -30 untuk mengambil kira julat osilasi yang lebih luas. Semua tetapan lain boleh kekal pada lalai mereka.
Indeks Saham — Lebih Cepat dan Ketat
Indeks seperti US30, NAS100, dan SPX500 mendapat manfaat daripada tempoh pelicinan yang lebih pendek. Tetapkan Tempoh Pantas kepada 11 dan Tempoh Perlahan kepada 21 untuk tindak balas lebih cepat terhadap perubahan momentum intrahari. Tingkatkan Respons Asas kepada 0.10 dan kurangkan Tempoh Isyarat kepada 6 untuk masa silang yang lebih ketat. Kekalkan OB pada 25 dan OS pada -25. Min Konfluens pada 3 berfungsi baik untuk kebanyakan dagangan indeks.
Kriptowang — Dibina untuk Kelajuan
Pasaran kripto bergerak pantas dan tren kuat. Pendekkan Tempoh Pantas kepada 10 dan Tempoh Perlahan kepada 21. Tingkatkan Respons Asas kepada 0.12 dan kurangkan Inersia Asas kepada 0.8 supaya penapis bertindak balas cepat kepada ayunan tidak stabil. Gunakan Tempoh Isyarat 5 untuk pengesanan silang lebih pantas. Tingkatkan had Maksimum Responsif kepada 0.5 untuk memberi ruang lebih kepada enjin adaptasi. Turunkan Min Konfluens kepada 2 kerana tren kripto cenderung lebih berarah dan kurang bising setelah terbentuk. Tetapkan OB kepada 30 dan OS kepada -30.
Bon & Instrumen Perlahan — Sabar dan Selektif
Perbendaharaan, bund, dan instrumen bergerak perlahan lain memerlukan tempoh lihat balik lebih panjang dan lebih sabar. Tingkatkan Tempoh Pantas kepada 18 dan Tempoh Perlahan kepada 34. Kurangkan Respons Asas kepada 0.05 dan tingkatkan Inersia Asas kepada 1.5 untuk mengelakkan penapis bertindak balas kepada turun naik kecil. Panjangkan Tempoh Isyarat kepada 10 dan Lihat Balik Adaptasi kepada 15. Tingkatkan Min Konfluens kepada 4 untuk memastikan hanya setup terkuat mencetuskan isyarat. Gunakan tahap OB/OS yang lebih ketat iaitu 20 dan -20 kerana instrumen ini berosilasi dalam julat yang lebih sempit.
Nota Penting
- Tidak Melukis Semula: Dengan "Perlukan Bar Disahkan" diaktifkan (lalai), semua isyarat anak panah silang berdasarkan bar yang ditutup dan tidak akan berubah atau hilang secara retrospektif.
- Nilai Garis Pulse dan Garis Isyarat pada bar semasa (belum ditutup) akan dikemas kini secara masa nyata — ini adalah tingkah laku standard untuk mana-mana penunjuk. Hanya isyarat anak panah yang dikawal oleh tetapan bar disahkan.
- Tahap OB/OS Tetap adalah garis rujukan mudah. Tidak seperti tahap dinamik, ia tidak menyesuaikan diri dengan keadaan pasaran yang berubah. Laraskan berdasarkan aset dan jangka masa yang anda dagangkan.
- Apabila menukar Julat Output dari Berpusat ke Dialihkan, ingat untuk mengemas kini tahap OB/OS dengan sewajarnya (rujuk jadual Garis Panduan Tahap di atas).
- Prestasi: Pada carta sangat panjang (50,000+ bar), pertimbangkan untuk menetapkan "Maksimum Bar untuk Kira" kepada 5000-10000.
Penafian
Penunjuk ini adalah alat analisis teknikal dan tidak merupakan nasihat kewangan. Prestasi lalu tidak menunjukkan hasil masa depan. Sentiasa gunakan pengurusan risiko yang betul dan gabungkan dengan bentuk analisis lain sebelum membuat keputusan dagangan.
Ringkasan
Key functionalities include:
- Adaptive filtering that adjusts responsiveness and inertia based on market conditions.
- Lag correction via two-pass error feedback to improve signal timeliness.
- A confluence filter requiring multiple conditions to confirm crossover signals, enhancing signal quality.
- Fixed overbought and oversold reference levels to identify potential reversal zones.
- Customizable parameters for momentum calculation, filter behavior, lag correction, and signal generation.
PME is optimized for one-hour charts but supports other timeframes and chart types. It provides presets tailored for different markets such as Forex majors, gold, oil, stock indices, cryptocurrencies, and bonds, allowing users to adjust responsiveness and signal sensitivity accordingly. The indicator is non-repainting when used with confirmed bar settings and is intended as a technical analysis tool to assist in trend detection and trade timing.
Ulasan pelanggan
5 | 25 % | |
4 | 75 % | |
3 | 0 % | |
2 | 0 % | |
1 | 0 % |
















![Logo "High-Low Divergence [Iridio Capital]"](https://cdn.ctrader.com/image/webp/10a9e91b-243a-43f6-bbfe-7376bad5a214_61554)
