

Description
FSP CumulativeDelta — Market Pressure Indicator
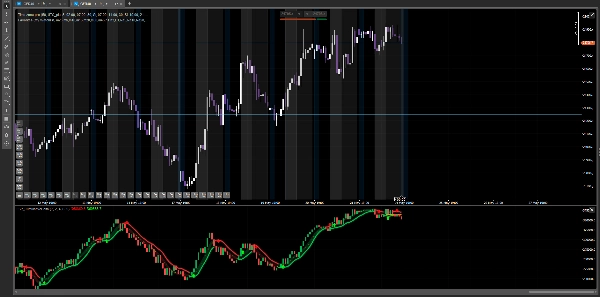
FSP CumulativeDelta is an advanced indicator that combines two powerful tools in a single window: bar-by-bar buying and selling pressure analysis, together with a trend detection system that helps you identify the precise moment the market is changing direction.
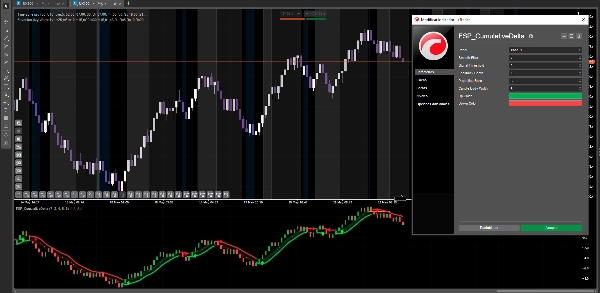
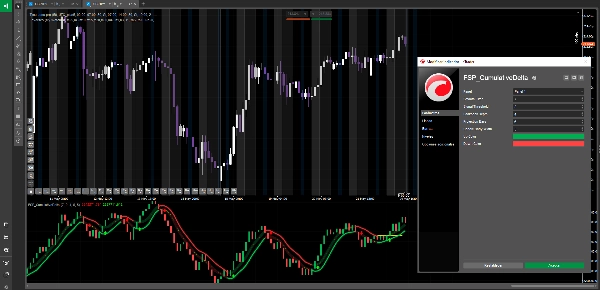
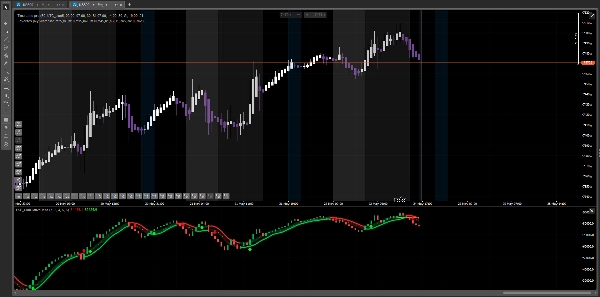
What does it do? The indicator displays market pressure candles in a separate sub-chart — not price, but the real force behind every move. Over those candles it draws a dynamic cloud that changes color according to the trend: green when buying pressure dominates, red when selling pressure takes control. It also plots key level lines and generates visual signals the moment the market breaks those levels, pointing to a potential entry.
How to use it? Add the indicator to any chart and timeframe. Watch the cloud color to understand the current pressure trend. When a green upward arrow appears, buying pressure has broken a key level — potential bullish opportunity. When a red downward arrow appears, selling pressure has broken a key level — potential bearish opportunity. You can toggle the trend signal on or off from the settings to display only the pressure candles. Candle colors are fully customizable from the configuration panel.
Compatible markets: Forex, indices, commodities, cryptocurrencies.
Risk disclaimer: Financial markets carry an inherent risk of capital loss. This indicator is an analysis tool and does not guarantee any results. Always trade with capital you can afford to lose and manage your risk with moderation on every trade.
Summary
Customer reviews
Discussion
FAQ
























Price