
Description
EMAScalpHistogram: Momentum Visualization for Trade Management
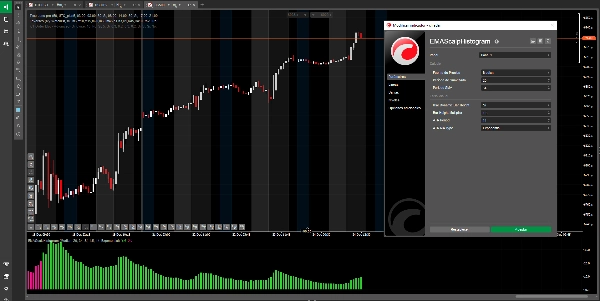
What is EMAScalpHistogram?
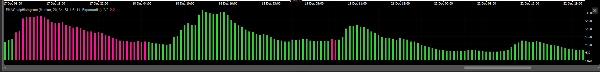
EMAScalpHistogram is an advanced technical analysis tool that transforms the complexity of market momentum into an intuitive and visually appealing histogram. Its design allows for the identification of trend strength and direction at a single glance.
- Green Bars (Bullish): Indicate strong buying momentum, suggesting that buyers are in control of the market.
- Pink Bars (Bearish): Indicate strong selling momentum, suggesting that sellers are dominating price action.
- Dynamic Height: The height of the bars is not fixed; it adapts to market volatility. Taller bars signal movements with more strength and conviction, while shorter bars indicate a pause or a weakening trend.
Primary Use and Recommended Strategy
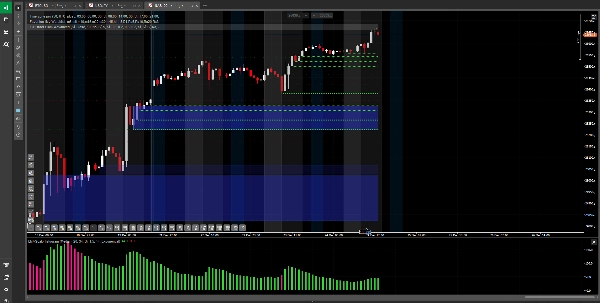
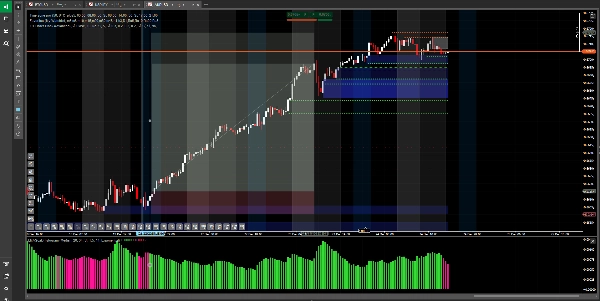
EMAScalpHistogram is an elite trade management tool, designed for traders who seek to maximize profits by holding positions with greater confidence. Its greatest value lies in helping you maintain and amplify your profits once you are already in a trade.
- Trend Confirmation: Its most powerful function is to validate the strength of a trend you have already identified. If you are in a long position and the histogram consistently shows green bars, it is a visual confirmation that the buying momentum remains intact.
- Trade Management (Hold and Amplify Profits):
- To Hold Positions: This is its most valuable application. Use it to decide when to hold a position with confidence. If the histogram continues to show bars in your favor, it gives you the discipline to not close a profitable trade prematurely due to minor market fluctuations.
- To Amplify Profits: By helping you hold the position throughout the entire strong momentum phase, it allows you to capture larger moves and amplify your profit potential.
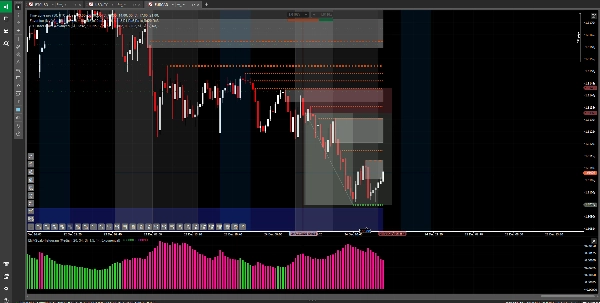
- Alert for Weakening Momentum: A change in the histogram's color (from green to pink or vice versa) is one of the first alerts that momentum is exhausting, suggesting it might be a good time to secure profits or adjust your exit strategy.
What to Avoid
Not an Entry Signal: Critically, EMAScalpHistogram is not designed to be used as a standalone signal to open new trades. As an indicator that confirms the strength of a move already in progress, using it for entry can result in late trades with high risk and limited profit potential.
Risk Warning and Disclaimer
The use of this indicator is at your own risk and responsibility. Trading financial instruments carries a high level of risk and may not be suitable for all investors. This tool does not constitute an investment recommendation or financial advice. Past performance is not a guarantee of future results. It is strongly recommended to test any strategy on a demo account before risking real capital.
Summary
Customer reviews
5 | 67 % | |
4 | 33 % | |
3 | 0 % | |
2 | 0 % | |
1 | 0 % |


!["Gaussian Channel [Iridio Capital]" logo](https://cdn.ctrader.com/image/webp/7c039209-5573-4a54-a072-f9528b503103_41960)
