Description
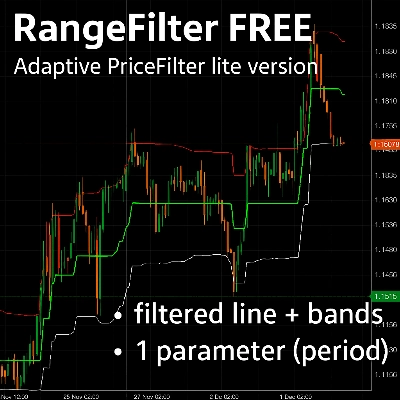
Daily Average Fibonacci - Automatic Daily Fibonacci Levels
Projects the average daily range in Fibonacci levels from the day's opening
What does this indicator do?
Daily Average Fibonacci automatically draws Fibonacci levels based on the average daily range. Each day, the indicator projects key levels both upward and downward from the opening price, helping you identify potential targets and reversal zones.
Main Features
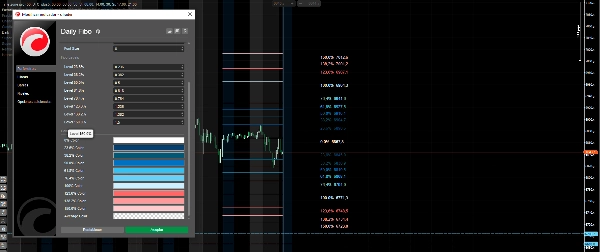
✅ Automatic daily update - Levels are automatically redrawn each day ✅ Customizable levels - Configure up to 8 different Fibonacci levels ✅ Custom colors - Each level has its own identifiable color ✅ Labels with prices - Shows both the percentage and exact price of each level ✅ Adjustable day average - Choose how many days to use for the average calculation (default 20)
Default Included Levels
- 0% - Day's opening (baseline)
- 23.6%, 38.2%, 50%, 61.8%, 76.4% - Internal retracements and extensions
- 100% - Complete average range
- 123.6%, 138.2%, 150% - External extensions
How to Use the Indicator
- Identify direction - The opening price (0%) is your reference point
- Look for bullish targets - Upper levels mark buy objectives
- Look for bearish targets - Lower levels mark sell objectives
- Reversal zones - When price reaches extreme levels (100%+), look for possible reversals
Adjustable Parameters
- Days for average calculation
- Custom Fibonacci levels
- Individual colors per level
- Show/hide labels and prices
- Font size
Perfect for traders looking for clear targets and probable price zones during the trading session.
Summary
Customer reviews
5 | 50 % | |
4 | 50 % | |
3 | 0 % | |
2 | 0 % | |
1 | 0 % |