
ICT Order Block
Indicator
705 downloads
Version 1.0, Nov 2025
Windows, Mac
3.5
Reviews: 2
Description
ICT Order Block - Institutional Order Blocks
Automatically identifies institutional order blocks on your charts. Visualize key zones where price could react.
What it does
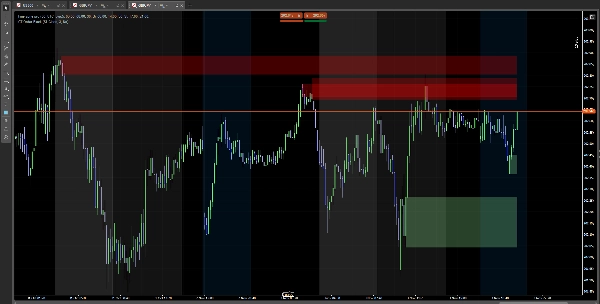
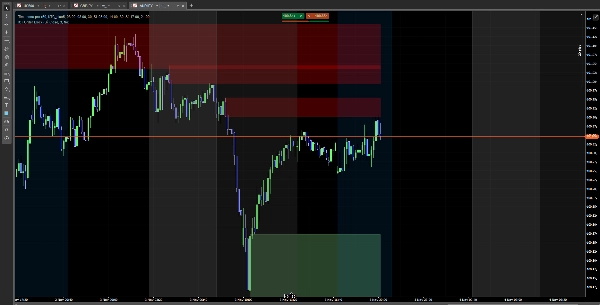
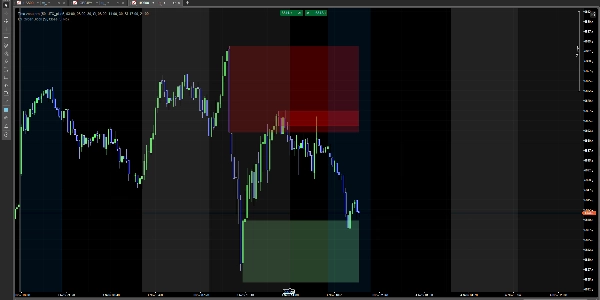
✅ Detects bullish blocks (institutional buying zones) ✅ Detects bearish blocks (institutional selling zones) ✅ Shows colored rectangles on important zones ✅ Blocks disappear when price breaks through them
How to Use It
Simple Installation
- Download the indicator
- Add it to your chart in cTrader
- Done! You'll see the blocks automatically
Configuration
Main Settings
- Show SCOB: Show or hide blocks
- Mitigation Method:
- Close: Block disappears on candle close
- Wick: Block disappears when touched
- Show Last X SCOBs: How many blocks to display (1-15)
- Apply Volatility Filter: Filter blocks based on volatility
Colors
- Bullish Color: Color for bullish blocks (light green by default)
- Bearish Color: Color for bearish blocks (red by default)
- Adjust transparency with the color picker
Interpretation
🟢 Green Blocks (Bullish): Potential support zones 🔴 Red Blocks (Bearish): Potential resistance zones
Note: This is a technical analysis indicator. Use it with proper risk management.
Summary
AI summary
ICT Order Block is a technical analysis indicator designed for use on cTrader charts. It automatically identifies institutional order blocks, highlighting key price zones where market reactions may occur. The indicator detects bullish order blocks (potential institutional buying zones) and bearish order blocks (potential institutional selling zones), displaying them as colored rectangles—green for bullish support areas and red for bearish resistance areas. These blocks visually represent important supply and demand zones that traders can monitor.
Key features include automatic block detection, configurable display options such as the number of blocks shown (1–15), and a volatility filter to refine block selection. Users can choose how blocks disappear: either when a candle closes beyond the block or when the block is touched by price wicks. Color customization and transparency adjustments are also available for better chart integration.
Installation involves adding the indicator to a cTrader chart, after which the blocks appear automatically. This tool supports analysis across Forex, Indices, and Cryptocurrency markets. It serves as a visual aid for identifying potential support and resistance zones based on institutional trading activity and should be used alongside proper risk management practices.
Indicator profile
Customer reviews
3.5
Reviews: 2
5 | 50 % | |
4 | 0 % | |
3 | 0 % | |
2 | 50 % | |
1 | 0 % |
Customer reviews
January 27, 2026
the zones are blocking the candles, zones need to be behind the candles .other than that it is good
Discussion
FAQ
Forex
Indices
Crypto
Products available through cTrader Store, including trading bots, indicators and plugins, are provided by third-party developers and made available for informational and technical access purposes only. cTrader Store is not a broker and does not provide investment advice, personal recommendations or any guarantee of future performance.


Price
Since 24/02/2025
15
Sales
1.82K
Free installs