
Descrizione
EMAScalpHistogram: Visualizzazione del Momentum per la Gestione del Trading
Cos'è EMAScalpHistogram?
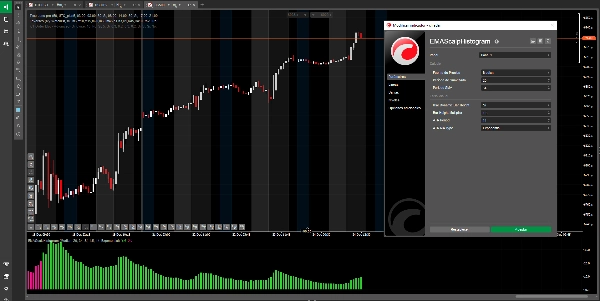
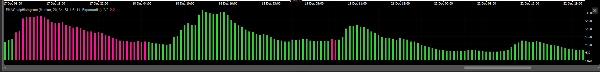
EMAScalpHistogram è uno strumento avanzato di analisi tecnica che trasforma la complessità del momentum di mercato in un istogramma intuitivo e visivamente accattivante. Il suo design consente di identificare la forza e la direzione del trend con un solo sguardo.
- Barre Verdi (Rialziste): Indicano un forte momentum di acquisto, suggerendo che gli acquirenti controllano il mercato.
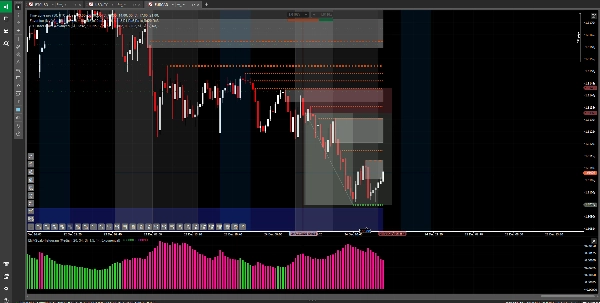
- Barre Rosa (Ribassiste): Indicano un forte momentum di vendita, suggerendo che i venditori dominano l'azione del prezzo.
- Altezza Dinamica: L'altezza delle barre non è fissa; si adatta alla volatilità del mercato. Barre più alte segnalano movimenti con maggiore forza e convinzione, mentre barre più corte indicano una pausa o un indebolimento del trend.
Uso Principale e Strategia Consigliata
EMAScalpHistogram è uno strumento d'élite per la gestione del trading, progettato per trader che cercano di massimizzare i profitti mantenendo le posizioni con maggiore fiducia. Il suo valore più grande risiede nell'aiutarti a mantenere e amplificare i tuoi profitti una volta che sei già in una posizione.
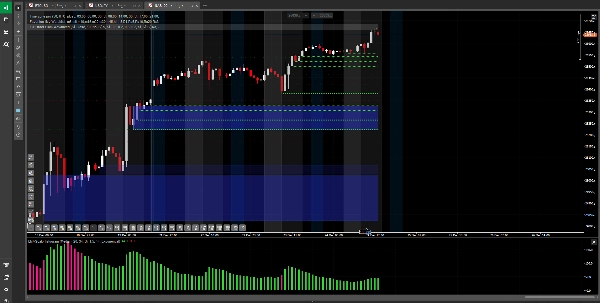
- Conferma del Trend: La sua funzione più potente è convalidare la forza di un trend che hai già identificato. Se sei in una posizione long e l'istogramma mostra costantemente barre verdi, è una conferma visiva che il momentum di acquisto rimane intatto.
- Gestione del Trading (Mantenere e Amplificare i Profitti):
-
- Per Mantenere le Posizioni: Questa è la sua applicazione più preziosa. Usalo per decidere quando mantenere una posizione con fiducia. Se l'istogramma continua a mostrare barre a tuo favore, ti dà la disciplina per non chiudere prematuramente un trade profittevole a causa di lievi fluttuazioni di mercato.
- Per Amplificare i Profitti: Aiutandoti a mantenere la posizione durante tutta la fase di momentum forte, ti permette di catturare movimenti più ampi e amplificare il potenziale di profitto.
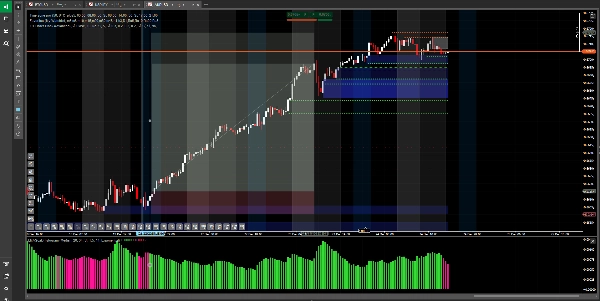
- Allerta per Momentum in Indebolimento: Un cambiamento nel colore dell'istogramma (da verde a rosa o viceversa) è uno dei primi segnali che il momentum si sta esaurendo, suggerendo che potrebbe essere un buon momento per mettere al sicuro i profitti o aggiustare la strategia di uscita.
Cosa Evitare
Non è un Segnale di Entrata: Fondamentalmente, EMAScalpHistogram non è progettato per essere usato come segnale autonomo per aprire nuove posizioni. Essendo un indicatore che conferma la forza di un movimento già in corso, usarlo per l'entrata può portare a trade tardivi con alto rischio e potenziale di profitto limitato.
Avvertenza sul Rischio e Disclaimer
L'uso di questo indicatore è a tuo rischio e responsabilità. Il trading di strumenti finanziari comporta un alto livello di rischio e potrebbe non essere adatto a tutti gli investitori. Questo strumento non costituisce una raccomandazione d'investimento o un consiglio finanziario. Le performance passate non garantiscono risultati futuri. Si raccomanda vivamente di testare qualsiasi strategia su un conto demo prima di rischiare capitale reale.
Riepilogo
Recensioni dei clienti
5 | 67 % | |
4 | 33 % | |
3 | 0 % | |
2 | 0 % | |
1 | 0 % |


