Descrizione
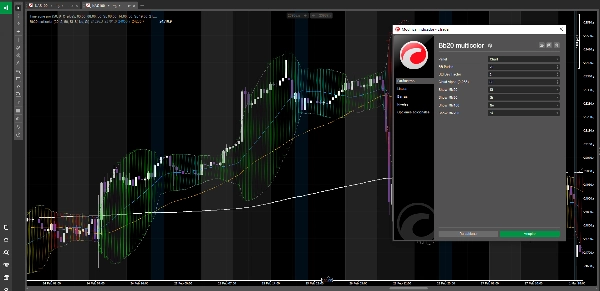
BB20 Multicolor
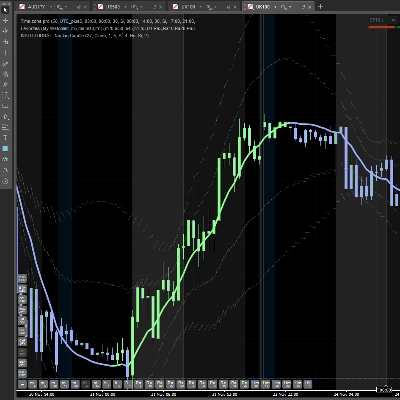
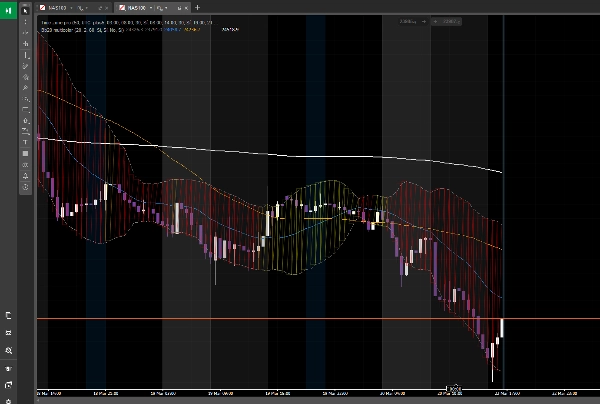
Un potente indicatore di identificazione del ciclo di mercato che si sovrappone direttamente al tuo grafico, codificando a colori l'azione del prezzo attraverso 8 distinti stati di mercato — da profondamente ribassista a completamente rialzista — utilizzando la relazione tra il prezzo e quattro medie mobili chiave (MM20, MM50, MM100, MM200) combinate con le Bande di Bollinger.
──────────────────────────
COME FUNZIONA
──────────────────────────
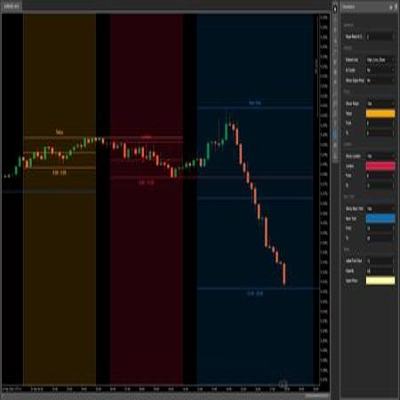
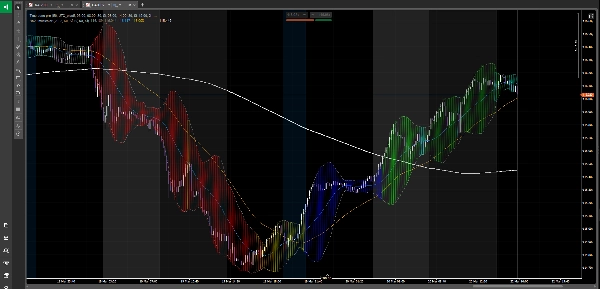
L'indicatore valuta costantemente la posizione del prezzo rispetto alle quattro medie mobili e assegna uno degli 8 colori alla zona della nuvola delle Bande di Bollinger, fornendoti una lettura visiva immediata della fase attuale del ciclo di mercato:
🔴 ROSSO — Chiaro trend ribassista
Il prezzo è sotto la MM200. Il mercato è dominato dai venditori. Bias: solo short.
🟠 ARANCIONE — Rimbalzo tecnico
Il prezzo è sotto la MM200 ma si è ripreso sopra la MM20. Un rimbalzo all'interno di un trend ribassista — non un'inversione. Zona comune di trappola rialzista.
🟡 GIALLO — Fase del ciclo 1
Il prezzo ha superato la MM50 ma le medie mobili sono ancora ribassiste. Prime segnali di recupero, non ancora confermati.
🔵 BLU — Tentativo di inversione del trend
MM100 e MM50 sono sotto la MM200, ma il prezzo sta iniziando a salire tra di esse. Zona di transizione ad alta volatilità — osserva attentamente.
⬜ GRIGIO — Neutro / indebolimento
Il prezzo è sopra la MM200 ma sotto la MM100. La struttura a lungo termine è ancora rialzista ma il momentum sta diminuendo. Zona di cautela.
🟢 VERDE LIME — Fase del ciclo 2
Prezzo e MM50 sono sopra la MM200. Un nuovo ciclo rialzista è in fase di conferma. Molti trader istituzionali iniziano a posizionarsi qui.
🪵 TEAL — Consolidamento sano
Il prezzo è sopra la MM200 e la MM100 ma si sta ritirando verso la MM50 o la MM20. Una pausa normale all'interno di un trend rialzista — potenziale zona di rientro.
🌲 VERDE SCURO — Ciclo rialzista maturo
Tutte le medie mobili completamente allineate: MM200 < MM50 < MM20 < Prezzo. Ambiente di tendenza più pulito. Resistenza minima al rialzo.
──────────────────────────
CARATTERISTICHE
──────────────────────────
• Zone della nuvola renderizzate nativamente con Chart.DrawTriangle di cTrader per riempimenti fluidi e dall'aspetto professionale
• Bande di Bollinger (superiore e inferiore) visualizzate accanto alla nuvola
• Tutte e quattro le medie mobili attivabili singolarmente (MM20, MM50, MM100, MM200)
• Periodo BB configurabile, fattore di deviazione standard e trasparenza della nuvola
• Funziona su qualsiasi strumento e qualsiasi timeframe
• Completamente open source — gratuito per sempre
──────────────────────────
COME USARLO
──────────────────────────
1. Usa il colore come filtro di contesto di mercato prima di effettuare qualsiasi operazione
2. Cerca long solo quando lo sfondo è verde (lime o scuro)
3. Cerca short solo quando lo sfondo è rosso o arancione
4. Usa giallo, blu e grigio come zone di transizione — riduci la dimensione o aspetta la conferma
5. Teal è la tua zona di rientro in un trend rialzista consolidato
Compatibile con qualsiasi strategia di trading. Particolarmente efficace se combinato con l'analisi del prezzo, l'analisi del volume o approcci basati sul sentiment.
Installalo, applicalo al tuo grafico e saprai immediatamente in quale fase si trova il mercato.
⚠️ AVVISO DI RISCHIO
Il trading di strumenti finanziari comporta rischi e non è adatto a tutti. Fai sempre la tua analisi, gestisci attentamente il rischio e non fare mai trading con soldi che non puoi permetterti di perdere.
Questo indicatore è uno strumento di analisi tecnica — non un consiglio finanziario. Usalo con saggezza.
Riepilogo
- Red: Clear bearish trend (price below MM200)
- Orange: Technical bounce within bearish trend
- Yellow: Early recovery signs (price above MM50, but MAs bearish)
- Blue: Trend reversal attempt with high volatility
- Gray: Neutral or weakening momentum (price above MM200 but below MM100)
- Lime Green: Confirmed new bullish cycle (price and MM50 above MM200)
- Teal: Healthy consolidation in bullish trend (price above MM200 and MM100, pulling back)
- Dark Green: Mature bullish cycle with aligned moving averages
Features include native cloud rendering using cTrader's Chart.DrawTriangle, toggleable moving averages, configurable Bollinger Bands parameters, and compatibility with any instrument and timeframe. The indicator is open source and free to use. It serves as a market context filter to guide trade decisions, recommending long positions in green zones and shorts in red/orange zones, with caution advised in transition colors. It complements various trading strategies, including price action and volume analysis.