
Market Sessions_noSourceCode
インジケーター
272 ダウンロード数
バージョン 1.0、Feb 2025
Windows、Mac
説明
概要
AIによる概要
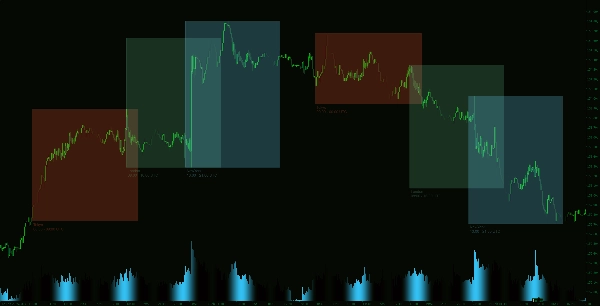
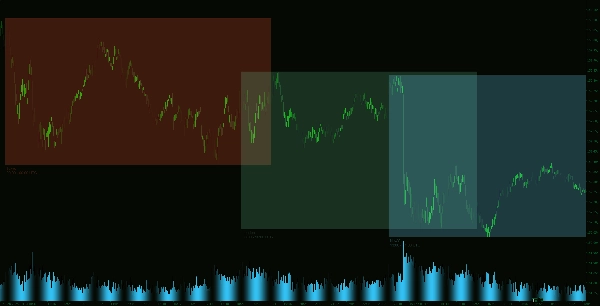
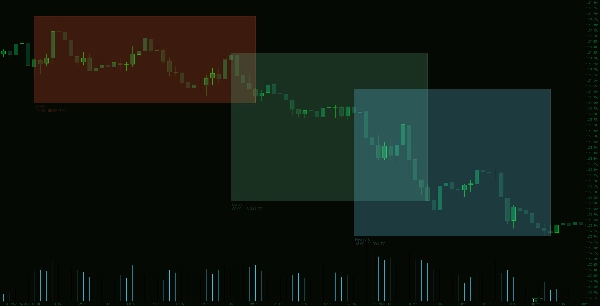
The Market Sessions Indicator is a trading tool designed to visually display the major market sessions—Tokyo, London, and New York—directly on trading charts. It highlights these sessions using customizable colors, allowing traders to tailor the appearance to their chart themes. The indicator draws rectangles representing each session’s high and low price ranges, providing a clear visual reference of market activity during these periods. Users can select how many previous days (up to 10) of session data to display, enhancing historical context. Additionally, the session highlights can be configured as filled or outlined rectangles, aiding in quick identification of active market zones. This indicator supports enhanced market session tracking to assist traders in analyzing price movements relative to global trading hours.
インジケーターのプロフィール
カスタマーレビュー
0.0
レビュー: 0
カスタマーレビュー
この商品にはまだレビューがありません。お使いになったことがある方は、ぜひレビューをお願いします。
ディスカッション
よくあるご質問
cTrader Storeで入手可能な取引ボット、インジケーター、プラグインなどの商品は、第三者の開発者が提供するものであり、情報と技術の取得のみを目的としてご利用いただけます。cTrader Storeはブローカーではなく、投資助言や個人的な推奨を行うことも、将来のパフォーマンスを保証することもありません。
この作成者の他の商品


価格
登録日 14/01/2025
55
販売
11.52K
無料インストール