
説明
説明:
毎日手動でラインを引くのをやめましょう。 Advanced HLC & Session Levels は、機関の参照ポイントに依存するプロのトレーダー向けに設計された包括的なインジケーターです。プライスアクション、ICTコンセプト、またはブレイクアウト戦略を取引する場合でも、このツールはチャートをすっきりと保ち、レベルを正確に維持します。
主な特徴:
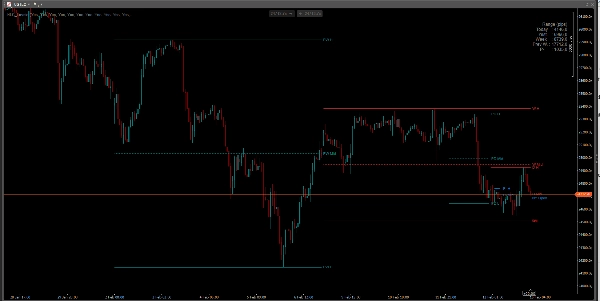
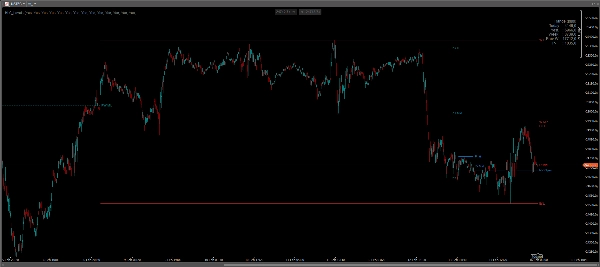
- 日次レベル: 今日と昨日の高値、安値、および中間(50%)レベルを自動的に表示します。
- 週次レベル: 現在および前週の高値、安値、および中間レベルを視覚化します。
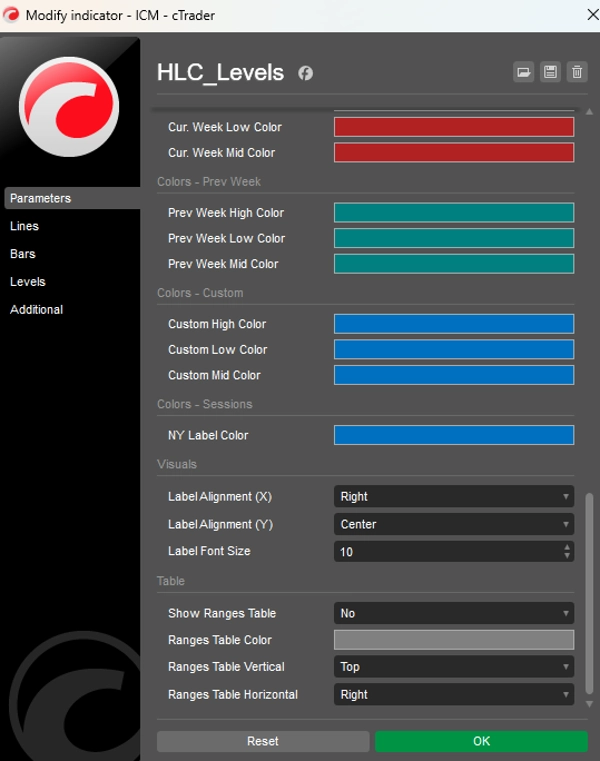
- NYミッドナイトオープン: 機関のニューヨーク00:00の価格レベル(真の日の始まり)用の専用トグルで、方向性のバイアスに重要です。
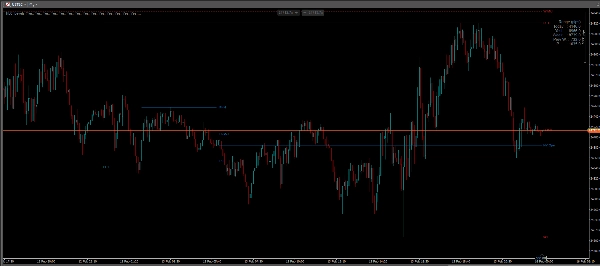
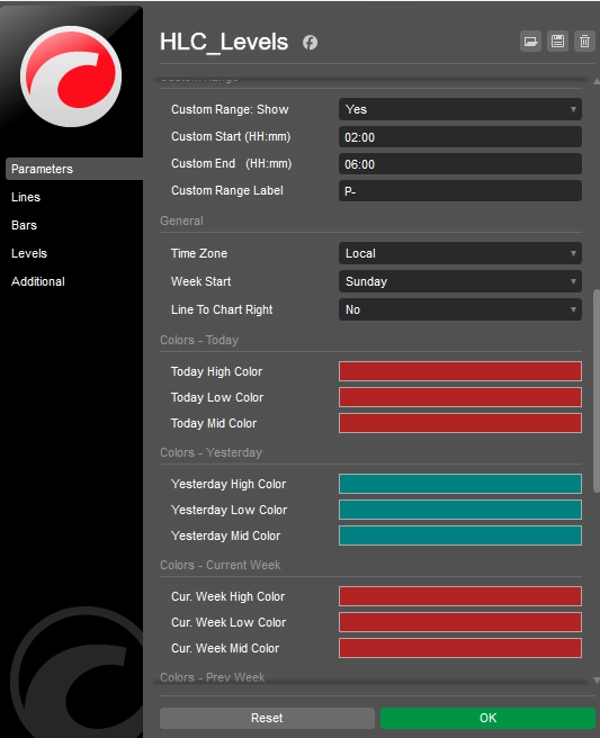
- カスタムレンジ/セッション: 自分の時間帯(例:アジアセッション、ロンドンオープン、またはイニシャルバランス)を定義します。インジケーターはその特定の期間の高値、安値、および中間を描画します。
- ボラティリティダッシュボード: 日、昨日、週、前週、およびカスタムレンジのピップレンジ(高値から安値の差)を表示するチャート上のテーブル。
- タイムゾーンインテリジェンス: ブローカー時間、UTC、NY、またはローカル時間で動作し、レベルがあなたの戦略に合うようにします。
なぜこのインジケーターを使うのか?
- 反応ポイント: 古い高値/安値や中間点は、しばしば強力なサポートやレジスタンスとして機能します。
- 中間(均衡): 50%レベルは「割引」対「プレミアム」価格を識別するための重要なポイントです。
- 完全にカスタマイズ可能: 任意のラインをオン/オフ切り替え可能。色、ラインスタイル、ラベル位置をテンプレートに合わせて変更できます。
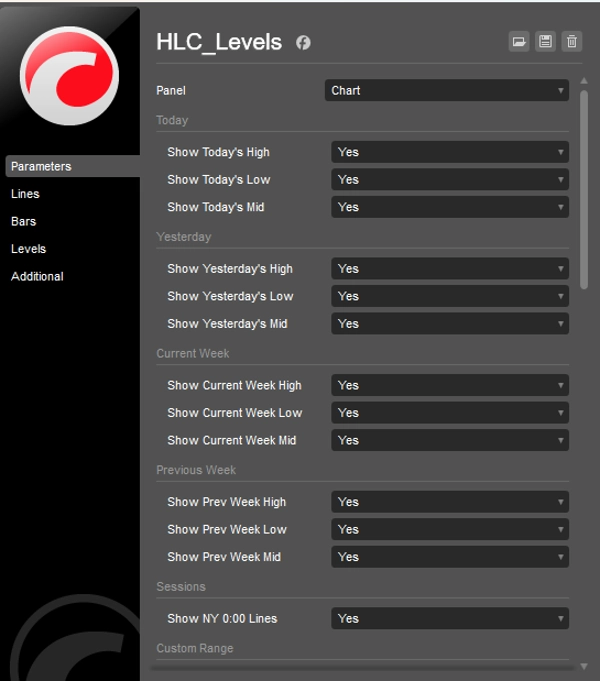
設定:
- 特定の時間枠(今日、昨日、週、前週)を有効/無効にします。
- 特定のセッション範囲のカスタム開始/終了時間。
- 「ライン延長」オプションでレベルを未来に投影します。
- すべてのラインのグループごとにカスタムカラー。
概要
インジケーターのプロフィール
カスタマーレビュー
4.3
レビュー: 3
5 | 33 % | |
4 | 67 % | |
3 | 0 % | |
2 | 0 % | |
1 | 0 % |
カスタマーレビュー
May 16, 2026
Bit weird to see there is no Close level eventhough it's called HLC_levels.. There is a high and low and a mid, but no close. I kinda find it essential to have a close though. Other than that is safes me huge amount of time daily to not set all these levels manually. So besides the lack of the close level i still like this indicator. Would love to see a new version with the added close level as the name suggests
March 2, 2026
A 5 minute check should not become a 30 minute rabbit hole, and the entry needs one more reason to make sense.
February 21, 2026
most of the value comes from the decision gets a little more breathing room. The market context still matters.
ディスカッション
よくあるご質問
Prop
Forex
Scalping
Indices
SMC
AI
XAUUSD
NAS100
USDJPY
cTrader Storeで入手可能な取引ボット、インジケーター、プラグインなどの商品は、第三者の開発者が提供するものであり、情報と技術の取得のみを目的としてご利用いただけます。cTrader Storeはブローカーではなく、投資助言や個人的な推奨を行うことも、将来のパフォーマンスを保証することもありません。


価格
24
販売
662
無料インストール