


الوصف
TP_SL أداة المخاطر والمكافآت المفيدة جدًا (بطريقة TradingView)
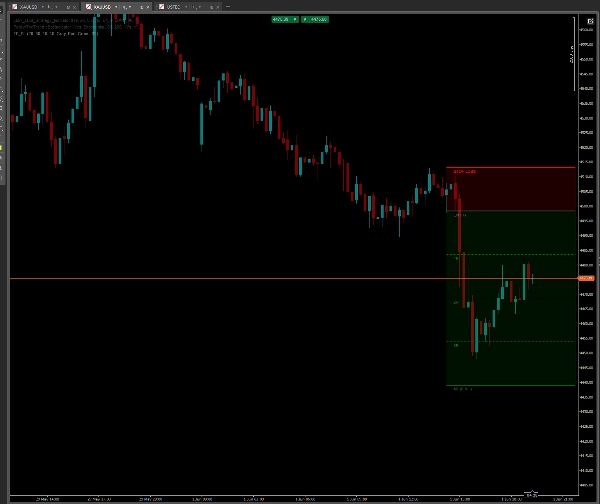
احضر أداة المراكز الطويلة/القصيرة النهائية بأسلوب TradingView مباشرة إلى مخططات cTrader الخاصة بك!
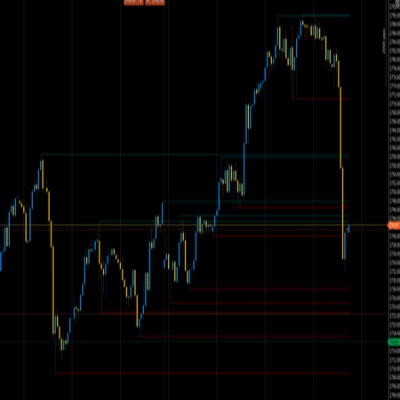
إذا فاتك يومًا أداة رسم سريعة وبديهية وتفاعلية لتخطيط تداولاتك، وحساب المخاطر، وعرض مستويات جني الأرباح بصريًا، فهذه المؤشر مناسب لك. مصمم للسرعة وجمالية المخطط النظيفة، يتيح لك تخطيط إعدادات تداولك في أقل من ثانية.
🔥 الميزات الرئيسية:
- تجربة TradingView في cTrader: يعيد إنشاء أداة المراكز الطويلة/القصيرة المرئية الشهيرة.
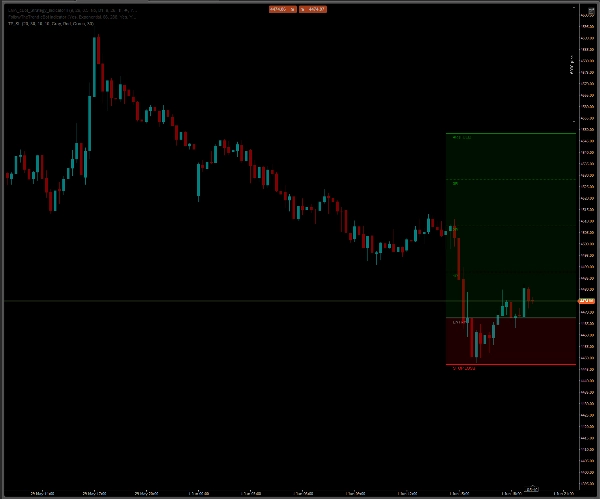
- الانعكاس الذكي التلقائي (طويل/قصير): ينتقل بسلاسة بين المراكز الطويلة والقصيرة. فقط اسحب خط وقف الخسارة فوق خط الدخول، وستنعكس مناطق جني الأرباح فورًا إلى الأسفل.
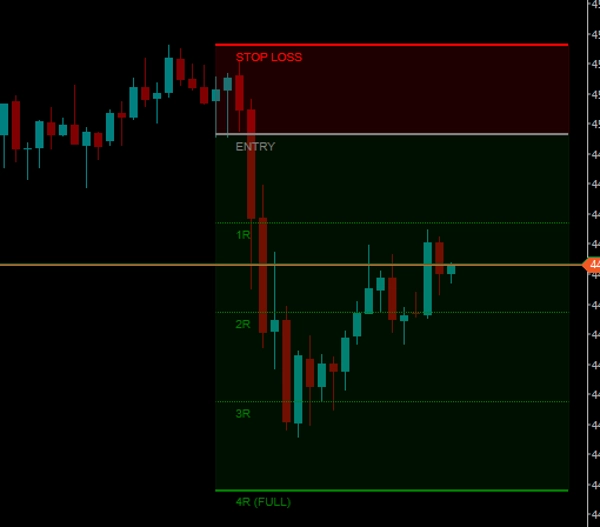
- مضاعفات المخاطر التلقائية (R-Math): يحسب تلقائيًا مخاطرتك (1R) بناءً على المسافة بين الدخول ووقف الخسارة، ويعرض ديناميكيًا مستويات جني الأرباح الدقيقة لـ 1R (خالي من المخاطر)، 2R، 3R، و4R (جني الأرباح الكامل).
- تقنية المخطط النظيف: على عكس الخطوط الأفقية القياسية التي تمتد بلا حدود إلى اليسار وتزدحم بياناتك التاريخية، تستخدم هذه الأداة خطوطًا محدودة. تخلق كتلة مرتبة ومغلقة تبقى تمامًا حيث تحتاجها.
- تتبع السعر الديناميكي: مع ظهور شموع جديدة، "تطفو" الأداة تلقائيًا إلى اليمين، محافظة على قربها من حركة السعر الحالية.
⚡ كيفية الاستخدام:
- ارسم: اضغط مع الاستمرار على مفتاح SHIFT وانقر بالزر الأيسر في أي مكان على المخطط. ستظهر الإعدادات فورًا.
- اضبط: ببساطة اسحب وأفلت خط "الدخول" الرمادي أو خط "وقف الخسارة" الأحمر إلى مستويات السعر التي تريدها. يتم حساب وضبط الشبكة بأكملها في الوقت الحقيقي.
- احذف: انقر على خط الدخول أو وقف الخسارة واضغط على مفتاح Delete على لوحة المفاتيح. يحتوي المؤشر على وظيفة تنظيف تلقائي تزيل الرسم بالكامل فورًا، دون ترك أي فوضى.
⚙️ إعدادات قابلة للتخصيص بالكامل:
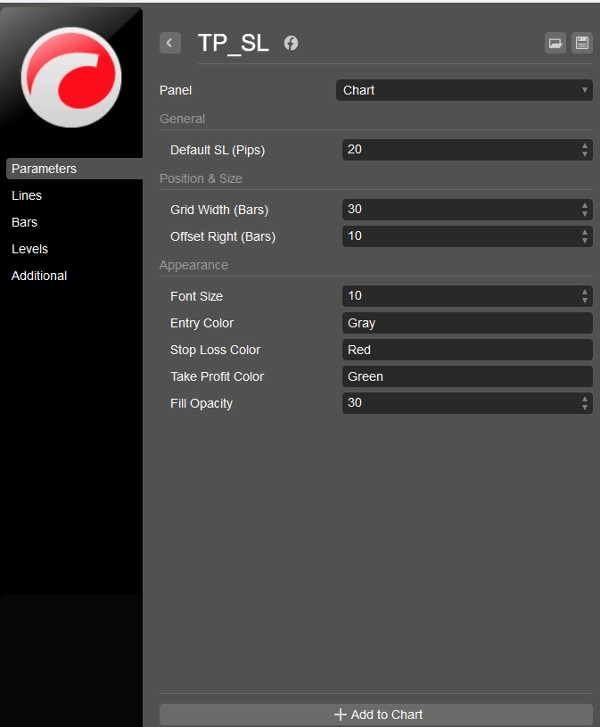
- عرض الشبكة والإزاحة: اضبط طول الأداة (بالأشرطة) ومدى قربها من السعر الحالي.
- المرئيات: تحكم كامل بالألوان. اكتب أي اسم لون قياسي (مثل DodgerBlue، Orange، Gray) لخطوط الدخول، وقف الخسارة، وجني الأرباح.
- الشفافية: اضبط شفافية المناطق الخلفية (من 0 إلى 255) لمظهر أنيق يشبه الزجاج.
- حجم النص: اجعل التسميات على المخطط تناسب دقة شاشتك تمامًا.
توقف عن التخمين لأهدافك. خطط تداولاتك بصريًا، احترم إدارة المخاطر الخاصة بك، وحافظ على نظافة مخططاتك تمامًا!
هذا المؤشر مجاني تمامًا لمجتمع cTrader.
الملخص
AI summary
TP_SL is a visual risk and reward indicator designed for cTrader that replicates the TradingView-style Long/Short position tool. It enables traders to quickly and intuitively plan trades by drawing and adjusting entry, stop loss, and take profit levels directly on the chart. The tool automatically calculates risk multiples (1R, 2R, 3R, 4R) based on the distance between entry and stop loss, projecting precise take profit zones.
Key features include a smart auto-flip function that switches between long and short positions by dragging the stop loss line above or below the entry line, clean bounded lines that avoid cluttering historical data, and dynamic price tracking that keeps the tool aligned with current price action. Users can draw the setup by holding SHIFT and left-clicking, then adjust levels with drag-and-drop, and delete the drawing with a single key press.
The indicator offers full customization of grid width, offset, colors, opacity, and text size to fit individual chart preferences. It supports visualization on bar-based data and is categorized under pattern indicators with a focus on key levels. TP_SL aims to facilitate precise trade planning and risk management while maintaining clean chart aesthetics.
Key features include a smart auto-flip function that switches between long and short positions by dragging the stop loss line above or below the entry line, clean bounded lines that avoid cluttering historical data, and dynamic price tracking that keeps the tool aligned with current price action. Users can draw the setup by holding SHIFT and left-clicking, then adjust levels with drag-and-drop, and delete the drawing with a single key press.
The indicator offers full customization of grid width, offset, colors, opacity, and text size to fit individual chart preferences. It supports visualization on bar-based data and is categorized under pattern indicators with a focus on key levels. TP_SL aims to facilitate precise trade planning and risk management while maintaining clean chart aesthetics.
ملف تعريف المؤشر
فئة المؤشر
النمط
نوع المخرجات
التصور
متطلبات البيانات
أعمدة السعر فقط
تقييمات العملاء
0.0
التقييمات: 0
تقييمات العملاء
لا توجد تقييمات لهذا المنتج حتى الآن. هل جرَّبته بالفعل؟ كن أول من يخبر الآخرين!
مناقشة
الأسئلة الشائعة
Key Levels
يتم توفير المنتجات المتاحة من خلال cTrader Store، بما في ذلك روبوتات التداول والمؤشرات والإضافات، من قبل مطوري الطرف الثالث وإتاحتها لأغراض الوصول المعلوماتي والفني فقط. cTrader Store ليس وسيطًا ولا يقدم نصائح استثمارية أو توصيات شخصية أو أي ضمان للأداء المستقبلي.




























السعر
32
المبيعات
980
التثبيتات المجانية