
Price Projection Swing Volume
Indicator
305 downloads
Version 1.0, Feb 2026
Windows, Mac
🚀Price Projection Swing Volume: 📈
https://chartshots.spotware.com/c/6980f0f0287fb
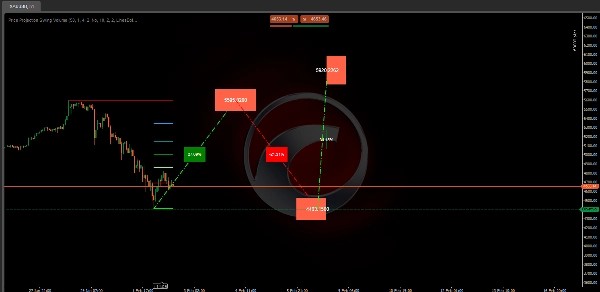
The Price Projection Swing Volume is an advanced forecasting tool designed to map out the most likely future path of an asset based on recent price swings and Fibonacci harmonic ratios. It identifies the current market range and projects a multi-stage "road map" for potential price action.
🔍 Market Analysis & Conditions
https://chartshots.spotware.com/c/6980f104dab21
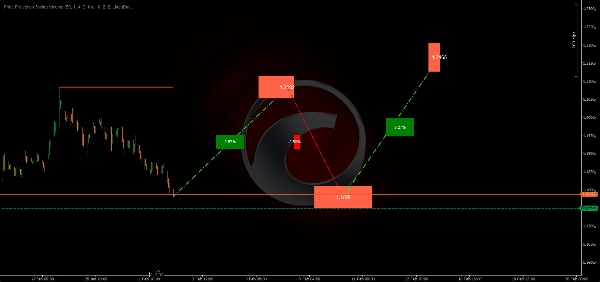
This algorithm focuses on identifying the "Market Envelope" by analyzing:
- Extreme Swing Points: It scans a specific Lookback Period (e.g., last 50 bars) to find the absolute Highest High and Lowest Low.
- Retracement Zones: It automatically calculates and plots five key Fibonacci levels (23.6%, 38.2%, 50%, 61.8%, and 78.6%) within the current swing to identify areas of interest.
- Harmonic Projections: Using the Projection Ratio (default 0.618), the algorithm calculates a three-segment future path based on measured moves from the most recent swing point.
🟢 How to Interpret Signals & Visuals
https://chartshots.spotware.com/c/6980f126d875a
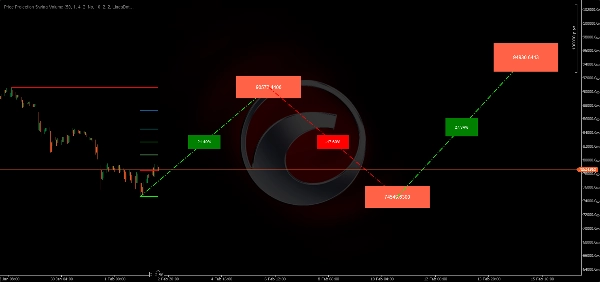
- Horizontal Swing Lines: The thick Red (High) and Green (Low) lines represent the current boundaries of the market. Price breaking these often signals a trend shift.
- The Projection Path (Dotted Lines): The diagonal lines forecast a "zigzag" move. This is the algorithm's prediction of how price might move to reach its ultimate target.
- Percentage Labels: Located on the diagonal lines, these show the expected % gain or loss for that specific segment of the move.
- Target Price Boxes: The colored boxes at the end of each segment provide the exact price level the algorithm is targeting.
⚙️ Key Settings & Parameters
- Lookback Period (50): Determines the scale of the swings. A higher number looks for "Macro" swings, while a lower number focuses on "Micro" scalping swings.
- Projection Ratio (0.618): This "Golden Ratio" determines the depth and height of the projected zigzags. You can adjust this for more or less aggressive targets.
- Visual Customization: Fully adjustable colors for Bullish/Bearish projections and specific Fibonacci levels to match your chart theme.
🚀 Typical Use Cases & Scenarios
- Target Setting: Use the projected price boxes to set Take Profit levels for swing trades.
- Anticipating Reversals: If the projection shows a deep retracement before a move up, traders can wait for the price to hit the "valley" dotted line before entering.
- Measured Moves: Excellent for traders who follow "ABCD" patterns or harmonic price action.
👤 Target Trader Profile
- Swing & Trend Traders: Ideal for those who hold positions for multiple days and need a roadmap of potential resistance.
- Harmonic Traders: Perfect for users who rely on Fibonacci ratios but want the math done automatically.
- Experience Level: Intermediate. Traders should understand that these are projections and should be used alongside other confirmations.
⚠️ Important Limitations & Usage Notes
- Dynamic Updating: The projections and swing levels will "shift" in real-time if a new High or Low is created within the lookback window.
- Initialization: The indicator needs a minimum amount of history (equal to the Lookback Period) before it can begin plotting accurately.
Indicator profile
0.0
Reviews: 0
Customer reviews
No reviews for this product yet. Already tried it? Be the first to tell others!
BTCUSD
Fibonacci
ZigZag
Scalping
EURUSD
GBPUSD
NZDUSD
XAUUSD
NAS100
USDJPY
Products available through cTrader Store, including trading bots, indicators and plugins, are provided by third-party developers and made available for informational and technical access purposes only. cTrader Store is not a broker and does not provide investment advice, personal recommendations or any guarantee of future performance.


Since 03/10/2024
161
Sales
37.63K
Free installs