
FVG & Imbalance Detector
Indicator
2 purchases
Version 1.0, Jan 2026
Windows, Mac
4.0
Reviews: 2
Description
In the world of Smart Money Concepts (SMC) and ICT, price imbalances are the "fingerprints" of big institutional players. When the market moves too fast, it leaves behind a Fair Value Gap (FVG)—a zone of inefficiency that the price almost always returns to "fill" or retest.
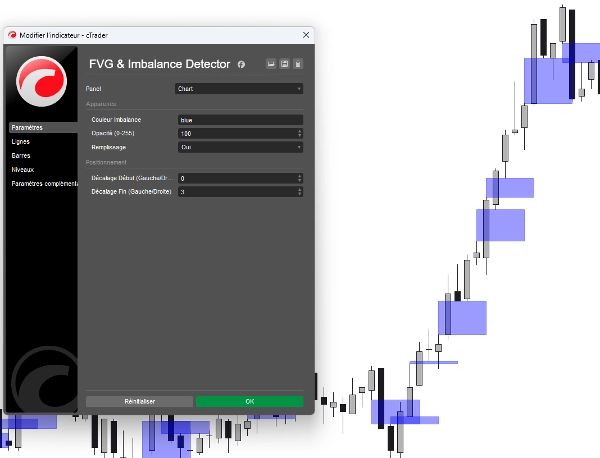
The FVG & Imbalance Detector for cTrader is a high-performance tool designed to spot these inefficiencies automatically. No more manual drawing—get clear, actionable zones directly on your chart.
Why this indicator is a must-have:
- 🚀 Spot Institutional Moves: See where big banks and hedge funds have entered the market with massive volume.
- 🎯 High-Probability Zones: Use identified imbalances as magnetic targets for take-profits or as "Golden Zones" for precision entries.
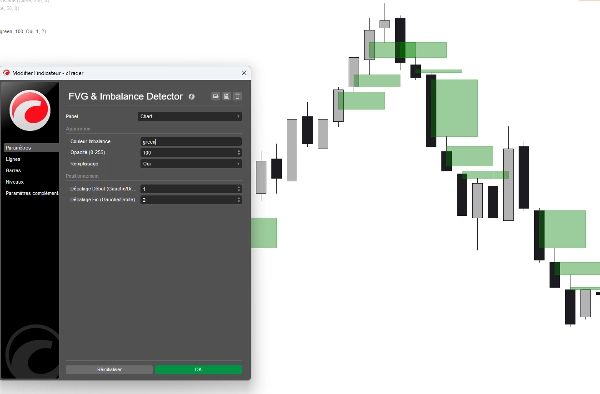
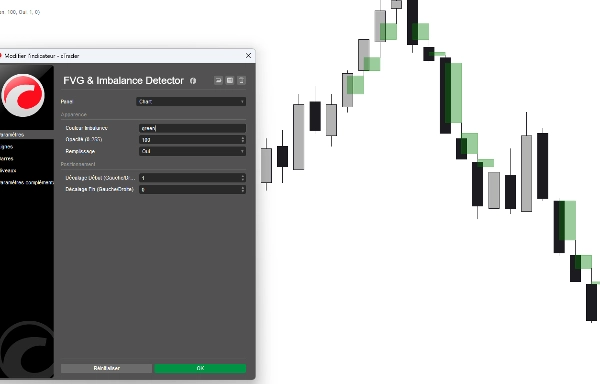
- 📈 Clean Visualization: High-quality rectangular overlays that make trend analysis effortless.
- 🔧 Fully Flexible: Unlike basic indicators, this version allows you to extend zones into the future or adjust their starting points to match your specific strategy.
Exclusive Features:
- Smart Detection Logic: Advanced algorithm identifies both Top (Bearish) and Bottom (Bullish) inefficiencies with pixel-perfect accuracy.
- Bi-Directional Offsets: Exclusive "Start" and "End" offset parameters allow you to project zones forward or backward to see how historical gaps align with current price action.
- Professional Color UI: Choose your preferred style via a clean dropdown menu (Yellow, Aqua, Red, etc.)—no more typing hex codes!
- Opacity Control: Adjust the transparency so the zones don't clutter your view of the price action.
- Optimized Performance: Lightweight code that won't slow down your cTrader platform, even on multiple charts.
How to use it:
- Identify the Gap: The indicator draws a box where an imbalance occurs between the high of the first candle and the low of the third.
- Wait for the Retest: Watch for the price to return to these boxes.
- Execute: Look for rejection patterns within the FVG zone for low-risk, high-reward entries.
Summary
AI summary
The FVG & Imbalance Detector is an indicator for the cTrader platform designed to identify Fair Value Gaps (FVG) and price imbalances, key concepts in Smart Money Concepts (SMC) and Institutional Cycle Trading (ICT). These gaps represent zones of market inefficiency created by rapid price moves, often reflecting institutional activity. The indicator automatically detects and highlights these zones on the chart with clear rectangular overlays, eliminating the need for manual drawing.
Key features include detection of both bullish (bottom) and bearish (top) imbalances with high precision, customizable zone extensions via start and end offset parameters, and adjustable opacity and color settings for clear visualization. The tool is optimized for performance to avoid slowing down the platform, even when applied to multiple charts.
Traders can use the indicator to spot where large institutional players have entered the market, identify high-probability zones for entries or take-profits, and monitor price retests of these inefficiency zones for potential trade execution. The indicator supports analysis across various markets including Forex, Indices, Commodities, and Crypto.
Indicator profile
Customer reviews
4.0
Reviews: 2
5 | 0 % | |
4 | 100 % | |
3 | 0 % | |
2 | 0 % | |
1 | 0 % |
Customer reviews
January 18, 2026
tested small first and that felt like the right move, and account protection still comes first.
January 14, 2026
Discussion
FAQ
Forex
Indices
Commodities
Crypto
AI
Products available through cTrader Store, including trading bots, indicators and plugins, are provided by third-party developers and made available for informational and technical access purposes only. cTrader Store is not a broker and does not provide investment advice, personal recommendations or any guarantee of future performance.
More from this author


Price
Since 27/10/2025
10
Sales