
说明
“逆向工程”概念
该指标的主要创新在于其 逆向工程 算法。通常,随机振荡器将价格数据转换为介于0到100之间的数字。该指标则相反:它采用振荡器的数学水平并 将其重新投射回价格刻度。
这使交易者能够将数学动量直接转换为 具体的价格水平(美元或点数),直接显示在图表上。
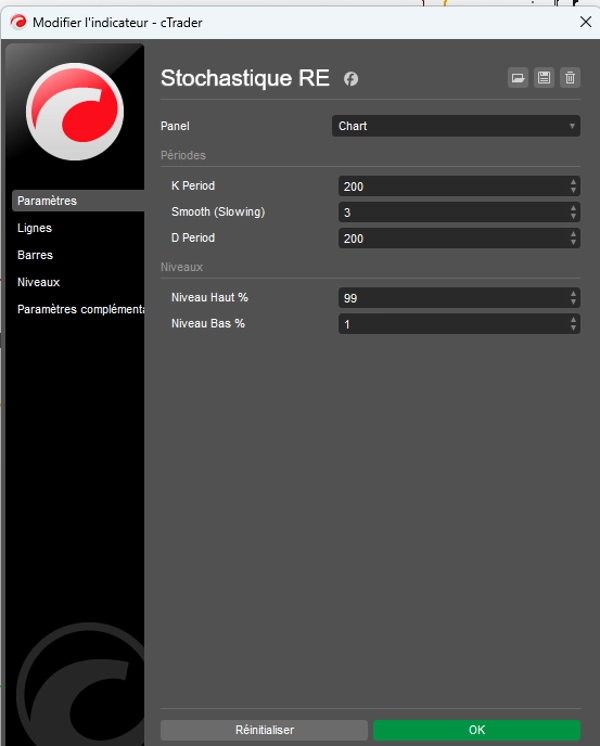
定义边界:上限(99%)和下限(1%)
与经典设置(80/20)不同,该指标默认设置为 1% 和 99%。此配置有其特定目的: 它定义了价格的物理极限。
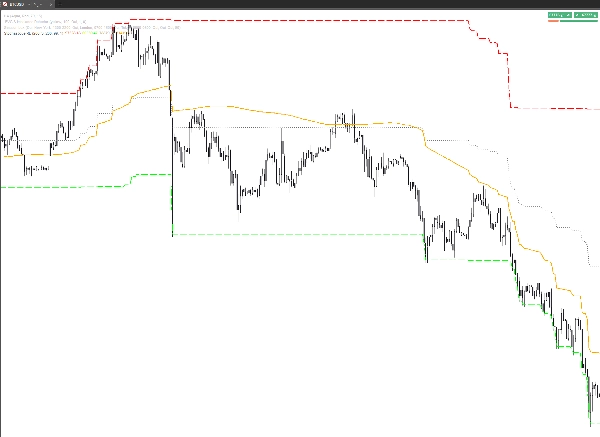
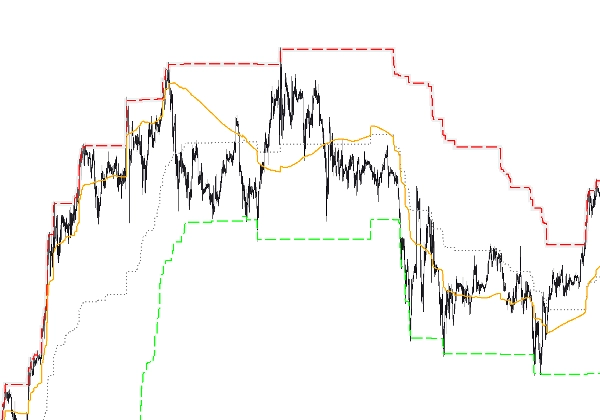
- 99%水平(价格上限): 它定义了市场在给定周期内达到其运动幅度99%耗尽之前的最高价格。它是价格的“边界”。
- 1%水平(价格下限): 它定义了当前周期的最低价格,即最终支撑位。它是价格相对于其近期历史向下能力耗尽99%的水平。
为什么它“定义价格”?
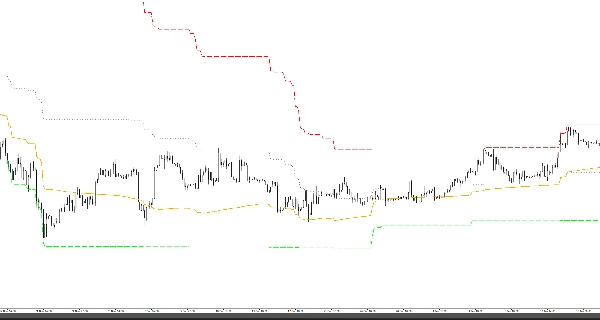
得益于该系统, 橙色信号%D 线不再只是一个在真空中移动的曲线。
- 价格定位: 它显示了由动量加权的“公平价格”的确切位置。
- 范围映射: 它将图表转变为一张地图,您可以看到当前价格“值不值”其潜力的1%或99%。
- 具体目标: 如果橙线向上移动,它不仅仅是想达到“80”;它是想达到由红线(99%)显示的 精确价格。
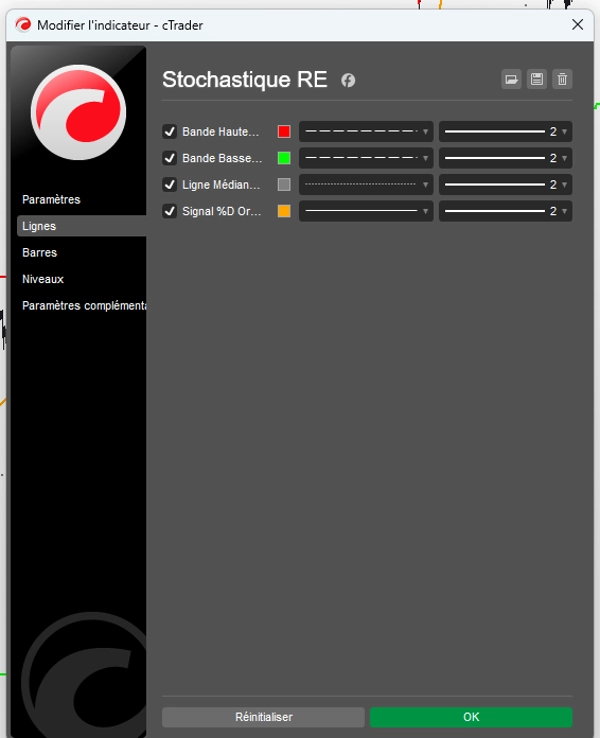
线条功能(线条标签)
一切均可自定义以实现即时视觉读取:
- 上轨(99%): 理论价格上限。
- 下轨(1%): 理论价格下限。
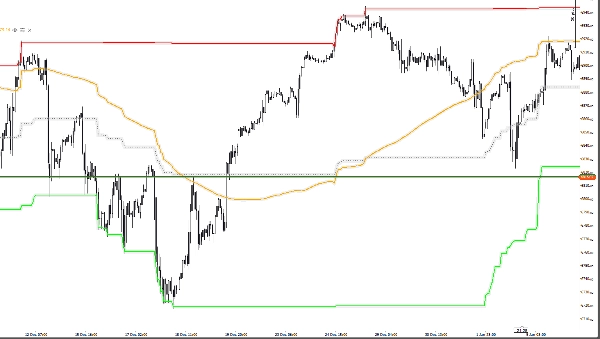
- 中线(50%): 中心枢轴点,均衡区。
- 橙色信号%D: 在下限和上限之间导航以定义市场方向的动态光标。
交易者总结
该指标不仅告诉您市场“超买”;它向您展示了 市场在何种确切价格 变得物理上过于昂贵(99%)或过于便宜(1%)。它是一种精密工具,将数学带回订单簿的现实。
摘要
指标配置
客户评价
4.6
评价:3
5 | 67 % | |
4 | 33 % | |
3 | 0 % | |
2 | 0 % | |
1 | 0 % |
客户评价
February 28, 2026
helps more when the trader avoids forced trades. Half size is enough at the start.
February 18, 2026
Solid enough as a backup opinion. Two sessions say more than one clean chart.
讨论
常见问答
BTCUSD
Forex
Breakout
Indices
EURUSD
Commodities
GBPUSD
NZDUSD
Crypto
Stocks
XAUUSD
NAS100
USDJPY
cTrader Store 提供的所有产品,包括交易机器人、指标和插件,均由第三方开发者提供,仅供信息参考和技术访问之用。cTrader Store 并非经纪商,不提供投资建议、个人推荐或任何未来业绩保证。
该作者的其他作品


价格
注册日期 27/10/2025
9
销售