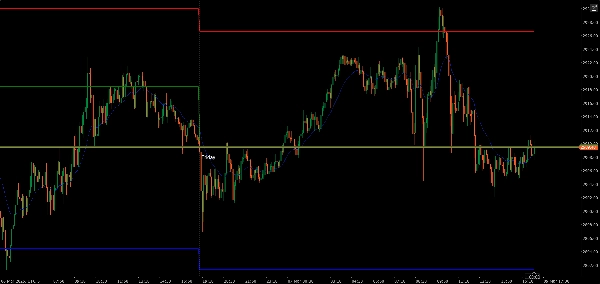
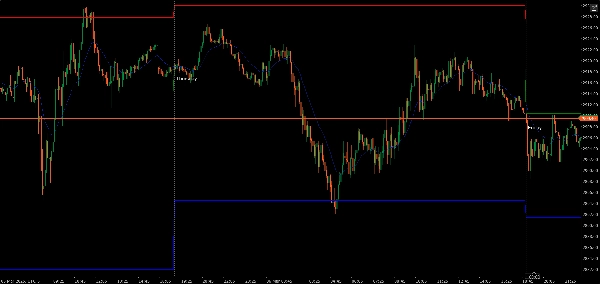
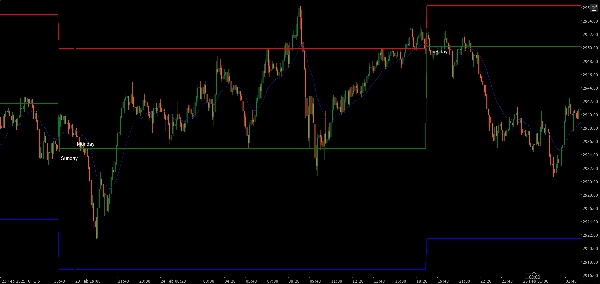
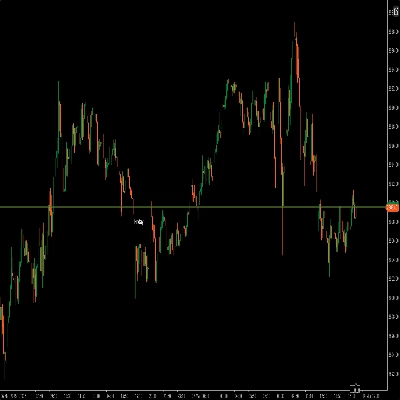
"trPDHLC" โลโก้
trPDHLC
"trPDHLC" ภาพที่อัปโหลด
ตั้งแต่ 08/03/2025
1
การขาย

previous day high low and closed indicator.

blue line show previous day low.

red line show previous day high.

green line show previous day closed.

Indicator profile
0.0
รีวิว: 0
รีวิวจากลูกค้า
ยังไม่มีรีวิวสำหรับผลิตภัณฑ์นี้ หากเคยลองแล้ว ขอเชิญมาเป็นคนแรกที่บอกคนอื่น!
Indices
Products available through cTrader Store, including trading bots, indicators and plugins, are provided by third-party developers and made available for informational and technical access purposes only. cTrader Store is not a broker and does not provide investment advice, personal recommendations or any guarantee of future performance.

เพิ่มเติมจากผู้เขียนคนนี้

daily period separate indicator.

นอกจากนี้คุณยังอาจชอบ

AbsorptionRatio_AutoRiskPanel is a single–symbol Absorption Ratio engine for cTrader that auto–calibrates its risk thres
Plots the equilibrium price levels based on previous daily highs and lows.
Fixed Range Volume Profile - TradingView Style (POC, VAH, VAL)
Un indicateur tout-en-un intelligent qui détecte la tendance, donne un avis clair (achat/vente)
"Gold Emperor" โลโก้
5.0
(1)
$ 20
/
$40
Gold Emperor: AI-driven XAUUSD dominance. Dynamic pivots, matrix trend logic, and institutional shield protection.
TAPE READER :-)
This indicator can be used to: change color, shape size, position, change font, increase or decrease, and other function
Automated position sizing based on risk, entry, and stop loss with ATR support and visual trade setup on charts.
RSI Pro Tool – Overbought & Oversold Made Easy
The Red & Green Zone Reversal Indicator detects overbought and oversold market conditions using Bollinger Bands and RSI.
"STC" โลโก้
5.0
(2)
ฟรี
Schaff Trend Cycle (STC) Indicator
The RSI NextGen is an advanced and modernized version of the classic Relative Strength Index (RSI)
The Trend Angle Indicator provides a clear and intuitive way to visualize market trends.
🌊 See when the market is truly in play. Tsunami measures Relative Volume by time-of-day 🌊
[Hamster-Coder] Pivot Points (Standard)
MainChart_EMA_BB is a main‑chart overlay indicator for cTrader that combines:
"CRT Pattern Indicator" โลโก้
4.8
(10)
ฟรี
The CRT indicator helps ICT traders identify candlestick patterns, enhancing analysis of higher timeframe on lower
Professional Order Flow Volume Delta Profile Insight for Advanced Trader
ตั้งแต่ 08/03/2025
1
การขาย