
Açıklama
CHoCH Breakout Bloğu
https://chartshots.spotware.com/c/69960085a796e
Bu gösterge, Fiyat Hareketi ve Akıllı Para Kavramları (SMC) metodolojileriyle işlem yapan traderlar için tasarlanmıştır. Önerilen kullanım:
- 🔍 Olası yapısal dönüşün ilk sinyali olarak CHoCH tespit edin.
- 👀 Oluşan ilgi bölgesini gözlemleyin: fiyatın genellikle yeni yönde devam etmeden önce geri döndüğü alandır.
- ⏳ Fiyatın bölgeye geri dönmesini bekleyin ve içinde, özellikle Fibonacci seviyeleri ile uyum arayın (özellikle 0.382, 0.5, 0.618 ve 0.786).
- ✅ Daha yüksek hassasiyetli giriş için bölgede (StructureBased modda ise) Yutan mum ile teyit edin.
- ❌ Fiyat bölgenin karşı sınırını ihlal ederse işlem geçersiz sayılır, çünkü gösterge o anda bölgeyi iptal eder.
https://chartshots.spotware.com/c/699600271b05d
📊 1. Üç Katmanlı Yapı Analizi
Gösterge, piyasayı üç iç içe hiyerarşik seviyede analiz eder, en azdan en önemliye doğru:
- 🔹 Kısa Vadeli: Üç ardışık mum karşılaştırılarak en son yerel yüksek ve düşükler tespit edilir. Orta mum, önceki ve sonraki mumdan daha düşükse yerel düşük, tam tersi ise yerel yüksek onaylanır.
- 🔸 Orta Vadeli: Kısa vadeli noktaların üzerine inşa edilir. Kısa vadeli salınımlar ardışık olarak daha düşük dipler veya daha yüksek tepeler oluşturduğunda (yani üç ardışık salınım bir yönü onayladığında), orta vadeli bir nokta belirlenir.
- 🔺 Uzun Vadeli: Tam olarak aynı şekilde, ancak temel olarak orta vadeli noktalar kullanılarak inşa edilir. Bu en önemli katmandır ve göstergenin ana olaylarını tetikler.
💡 Bu kademeli yapı, yalnızca gerçek yapısal ağırlığı olan hareketlerin sinyal üretmesini sağlar, kısa vadeli gürültüyü filtreler.
🔄 2. CHoCH — Karakter Değişimi
CHoCH, göstergenin merkezi olayıdır. Şu durumlarda gerçekleşir:
- 🟢 Boğa CHoCH: Fiyat, önceki uzun vadeli yapısal yüksek seviyenin üzerinde kapanır ve önceki piyasa yönü düşüştedir. Bu, satıcıların kontrolü kaybettiğini ve piyasanın yukarı yönlü dönebileceğini gösterir.
- 🔴 Ayı CHoCH: Fiyat, önceki uzun vadeli yapısal düşük seviyenin altında kapanır ve önceki yön yükseliştir. Bu, alıcıların kontrolü kaybettiğini ve piyasanın aşağı yönlü dönebileceğini gösterir.
Bir CHoCH tespit edildiğinde, gösterge şunları çizer:
- ➡️ Tam kırılma seviyesinde yatay bir çizgi (ayarlandığı stil ve kalınlıkta)
- 🏷️ O çizginin üzerinde "CHoCH" etiketi
- 🟥🟩 Yarı saydam bir ilgi bölgesi
🗺️ 3. İlgi Bölgesi
CHoCH'tan hemen sonra gösterge, otomatik olarak önemli bir fiyat bölgesi belirler:
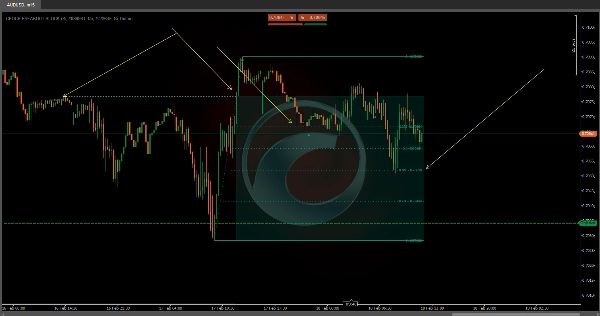
- 🟢 Boğa CHoCH'ta: Bölge, kırılma seviyesi (CHoCH) ile yapısal salınım ve kırılma anı arasındaki en düşük nokta arasında uzanır. Bu bölge, fiyatın yukarı devam etmeden önce likidite arayabileceği alanı temsil eder.
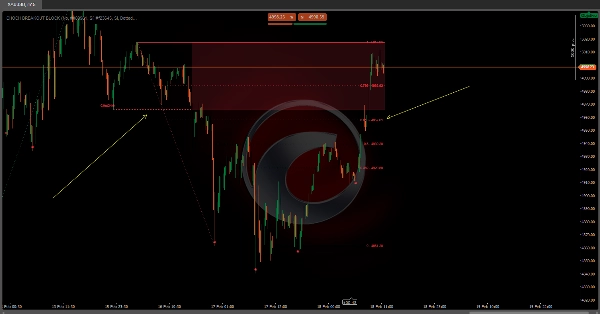
- 🔴 Ayı CHoCH'ta: Bölge, salınım ile kırılma arasındaki en yüksek noktadan CHoCH seviyesine kadar uzanır. Bu, fiyatın aşağı devam etmeden önce likidite arayabileceği alanı temsil eder.
Bölge, fiyat sınırlarına saygı gösterdiği sürece otomatik olarak bar bar genişler. Fiyat karşı sınırı ihlal ettiğinde, bölge genişlemeyi durdurur — bu, test edildiği veya geçersiz kılındığı anlamına gelir.
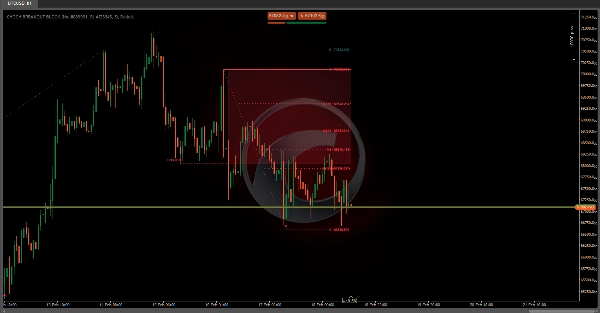
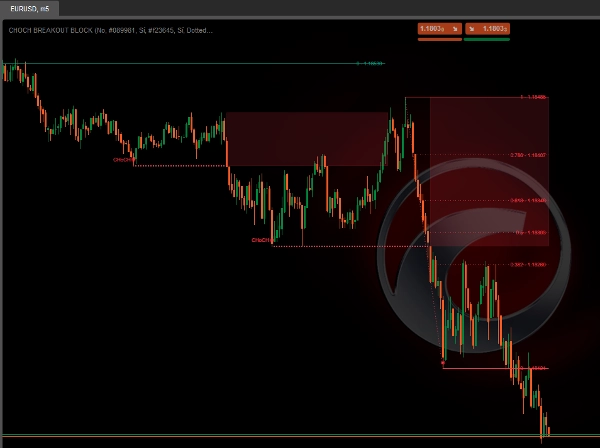
👁️ Grafik görüntüsünde görüldüğü gibi, yarı saydam kırmızı bölgeler tespit edilen CHoCH olaylarından sonra bu ayıcı ilgi bölgelerini temsil eder.
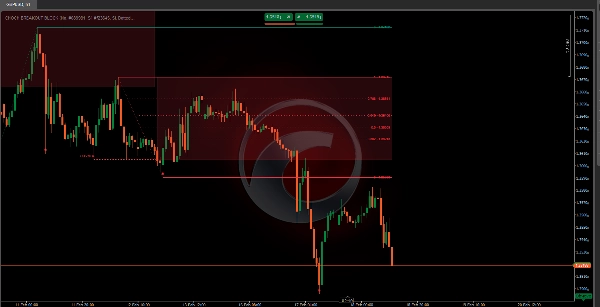
📐 4. Otomatik Fibonacci Seviyeleri
Bir CHoCH tespit edildikten sonra, gösterge Fibonacci'yi hemen çizmez. Fibonacci, piyasa yeni yönün gerçek yapısal ağırlığını onayladığında ikinci aşamada görünür. Bu iki adımda gerçekleşir:
Adım 1 — CHoCH gerçekleşir: 🏷️ Kırılma çizgisi, etiket ve ilgi bölgesi çizilir. Fibonacci henüz görünür değildir.
Adım 2 — Piyasa CHoCH yönünde yeni bir uzun vadeli salınım oluşturur: 📐 Ancak o anda gösterge, kırılma referans noktası ile yeni onaylanan salınım arasında Fibonacci seviyelerini otomatik olarak projekte eder.
📌 Örnek: Boğa CHoCH'ta, Fibonacci kırılma sırasında bulunan en düşük noktadan piyasanın sonrasında oluşturduğu ilk uzun vadeli yüksek noktaya çizilir. Fiyat yükseliyor ancak henüz yapısal salınımı konsolide etmediyse, Fibonacci seviyeleri henüz görünür olmayacaktır — bu kasıtlıdır ve hata değildir.
Aktif hale geldikten sonra seviyeler, yapı geçerli olduğu sürece bar bar genişler ve yeni yapısal bir kırılma ortaya çıkarsa otomatik olarak yeniden hesaplanır. Mevcut seviyeler şunlardır:
Seviye
Ortak Anlam
0
Hareketin başlangıcı
Küçük düzeltme
⭐ İlk önemli düzeltme
0.5
⭐ Orta seviye
⭐ Altın Oran
Altın Oran varyantı
⭐ Derin düzeltme
1
%100 genişleme
🕯️ 5. Yutan Mum Tespiti
Gösterge, ek bir uyum sinyali olarak yutan mum formasyonu tespiti içerir:
- ▲ Büyük yeşil bir mumun önceki küçük kırmızı mumu tamamen emdiği durumlarda boğa yutan mum oluşur.
- ▼ Büyük kırmızı bir mumun önceki küçük yeşil mumu tamamen emdiği durumlarda ayı yutan mum oluşur.
İki görüntüleme modu vardır:
- 📋 Tümü: Grafikte görünen tüm yutan mum formasyonlarını gösterir.
- 🎯 StructureBased: Sadece aktif bir ilgi bölgesi içinde oluşan yutan mum formasyonlarını gösterir, sinyalin alaka düzeyini önemli ölçüde artırır.
Özet
When a CHoCH occurs, the indicator marks the breakout level with a horizontal line and label, and automatically creates a semi-transparent interest zone where price is likely to return before continuing in the new direction. This zone extends dynamically as long as price respects its boundaries and is invalidated if price breaks the opposite boundary.
The indicator also projects Fibonacci retracement levels automatically after the market confirms the new trend direction by forming a new long-term swing. Supported Fibonacci levels include 0.236, 0.382, 0.5, 0.618, 0.65, 0.786, and 1. Additionally, it detects bullish and bearish engulfing candle patterns as confluence signals, with options to display all patterns or only those occurring within active interest zones for higher precision.
This tool supports multiple markets including BTCUSD, EURUSD, GBPUSD, NZDUSD, XAUUSD, NAS100, and USDJPY.
Müşteri değerlendirmeleri
5 | 100 % | |
4 | 0 % | |
3 | 0 % | |
2 | 0 % | |
1 | 0 % |


