
Açıklama
🚀 10.000+ tüccar zaten en iyi göstergelerimizi kullanıyor🏆
Profesyonellerin neden bizi seçtiğini keşfedin – en güçlü araçlar cTrader’da (göstergeler, algoritmalar ve cBot’lar) sizi bekliyor.
👉 Tüm en iyi sistemlerimizi buradan edinin:
_______________________________________________
_______________________________________________
📌 Piyasa Yapısı Göstergeleri
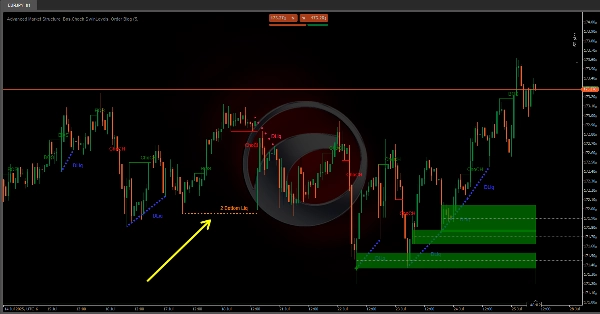
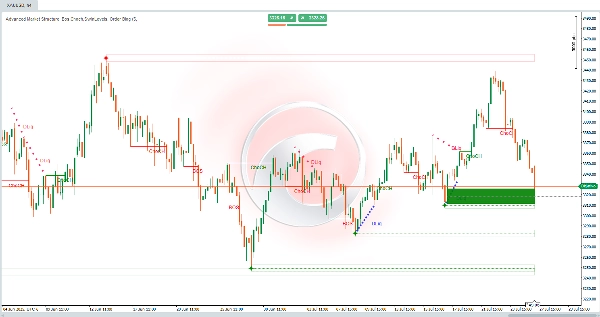
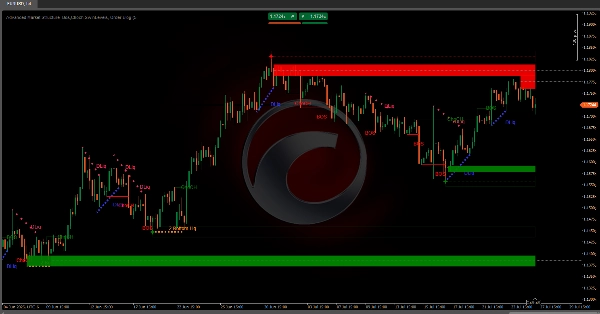
· ✅ AdvancedMarket Structure: Bos, Choch, SwinLevels, Order Blocks, Piyasa Yapısı& Likidite Bulucu
· 🔄 Dinamik Piyasa YapısıDönüş Noktalarının Analizi
· 🧱 Order Block
· ⚖️ Piyasa Dengesizliği
· ⛓️ BOS & CHOCH
· 🧠 ICT Güç 3
______________________________________________________________-
Mağaza cBot’ları : 🧠 Altın & BTC KırılmaOturum Pivotları 🧠
_______________________________________________
🔚 Akıllı Çıkış Sistemleri
· 📍 Takip Eden Akıllı Algoritma
_______________________________________________
📐 ZigZag Göstergeleri
· 🔍 ZigZag Fiyat Likidite Projeksiyonu
· ➖ ZigZag
· 🎯 Zig-Zag Uç Nokta Takipçisi
_______________________________________________
🧱 Destek & Direnç Göstergeleri
· 🟩 SmartTrend Destek & Direnç Çizgileri
· 🧱 Tüm Destek ve Direnç Seviyeleri
_______________________________________________
📊 Trend & Kanal Göstergeleri
· 📊 Süpertrend
· 🧠 Uyarlanabilir Trend Kanalı
· 🔁 Reaktif Hareketli Ortalama
_______________________________________________
💧 Hacim & Likidite Araçları
· 🔍 Momentum Adil Değer Boşluğu
· 🕒 Adil Değer Boşluğu Oturumları
_______________________________________________
⚡ Momentum & RSI Göstergeleri
· 🔎 Çok Katmanlı Mum Eğilimi Takipçisi
_______________________________________________
🔮 Tahmin & Projeksiyon Araçları
· 📐 Linreg & ATR’ye Dayalı Tahmin
· 📏 Fibonacci Doğrusal RegresyonÇoklu zaman dilimi
· 📈 Hacim Destekli Piyasa Akışı Projeksiyonu
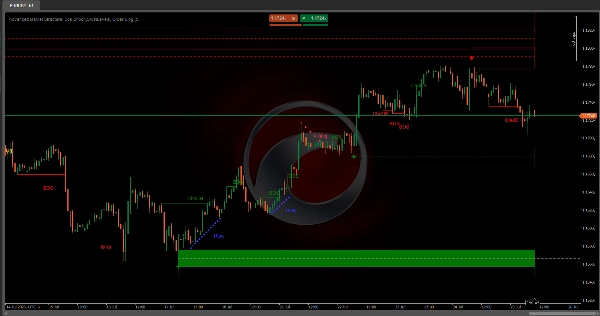
Advanced Market Structure: Bos, Choch, SwinLevels, Order Blocks, Piyasa Yapısı & Likidite Bulucu.
Nedir?
Bir gelişmiş fiyat hareketi aracı birden fazla teknik analiz kavramını güçlü bir göstergede birleştirir. Entegre eder:
- 📊 Piyasa Yapısı
- 🔄 Salınım Seviyeleri
- 🧱 Order Block’lar
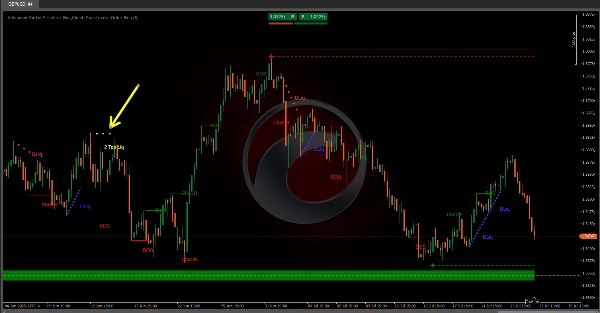
- 💧 Likidite Bulucu (2 Dip & 2 Tepe)
Amaç: Ana giriş/çıkış noktalarını, trendleri, destek/direnç ve fiyatın tepki verdiği kurumsal bölgeleri belirlemek.
🧠 Temel Felsefe: Akıllı Para
Piyasalar, üstün kaynaklara sahip kurumsal oyuncular (bankalar, fonlar, piyasa yapıcılar) tarafından yönlendirilir. Aşağıdaki amaçlarla desenler oluştururlar:
- 🕵️♂️ Operasyonları gizlemek birikim/dağıtım sırasında.
- 🎯 Likidite avlamak (perakende stop kayıpları).
- 🚀 Dengesiz piyasalarda patlayıcı hareketleri beslemek.
🔑 Bileşenler:
1. Order Block’lar
- Nedir: Kurumların büyük emirler verdiği, dengesizlikler yaratan bölgeler.
- Türleri:
-
- 🟢 Boğa (Talep): Agresif kurumsal alım.
- 🔴 Ayı (Arz): Agresif kurumsal satış.
- Ana Sinyal: Fiyatın order block’larda sıçraması/geri dönmesi.
- Tespit:
-
- Yükseklerde (ayı) veya düşüklerde (boğa) hacim artışları.
2. Salınım Seviyeleri
- Amaç: Ana yüksek/düşükler aracılığıyla piyasa yapısını tanımlamak.
- Kritik Kırılmalar:
-
- 🔺 Salınım Yüksek Kırılması: Boğa devamı.
- 🔻 Salınım Düşük Kırılması: Ayı devamı.
3. Yapı Kırılması (BoS)
- Tanım: Salınım yükseklerinin (boğa) veya düşüklerinin (ayı) kararlı kırılması.
- Fraktal Bağlantısı:
-
- 🐂 Boğa Fraktalı: Ortada en düşük olan 5 mumluk desen.
- 🐻 Ayı Fraktalı: Ortada en yüksek olan 5 mumluk desen.
4. Karakter Değişimi (ChoCh)
- Tanım: Trend dönüşünü işaret eden yapısal değişim.
- Tetikleyiciler:
-
- Yükselen trendlerde salınım düşüklerinin kırılması (ayı ChoCh).
- Düşen trendlerde salınım yükseklerinin kırılması (boğa ChoCh).
5. Likidite Bölgeleri
- Türleri:
-
- ⚖️ Statik: Kümeleşmiş yüksek/düşüklerin yatay seviyeleri (ATR filtreli).
- 🏃 Dinamik: Dik pivotları birleştiren trend çizgileri.
- Ana Desenler:
-
- 🕯️ 2 Tepe/2 Dip: Kurumsal stop avları.
- ⛰️ Üçlü Tepe/Dipler: Yüksek sıkışma bölgeleri.
🎯 Ana Uygulamalar
- ✅ Trendleri/dönüşleri belirlemek BoS/ChoCh aracılığıyla.
- 📍 Destek/direnç yerlerini bulmak salınım seviyeleri ve likidite bölgeleri kullanarak.
- 🏦 Kurumsal order block’ları tespit etmek.
- 🎯 Fiyat hedeflerini tahmin etmek likidite bölgeleri aracılığıyla.
🔄 Akıllı Para Stratejileri
FazSinyalleriKurumsal Hareket
1. Birikim
ChoCh boğa + Talep order block 📈
Akıllı Para alır
2. Yükseliş
Ardışık BoS + FVG boşlukları 🚀
Perakende momentumu besler
3. Dağıtım
ChoCh ayı 2 Tepe Likidite’de 🎯
Akıllı Para satar
4. Düşüş
Ayı BoS + İndirim bölgesi tasfiyesi 🔻
Diplerde stop avları
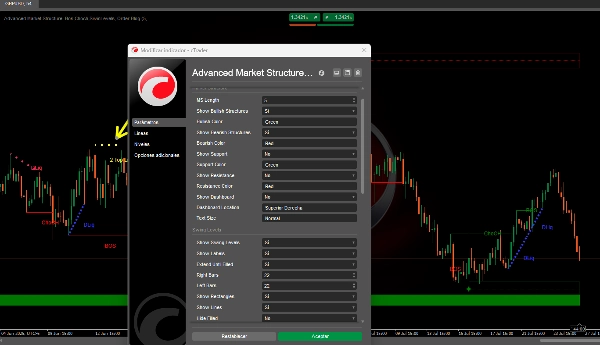
⚙️ Parametre Ayar Kılavuzu
Piyasa Yapısı
MS Uzunluğu:-
- ⬆️ Artır: Daha az ama daha güvenilir fraktallar.
- ⬇️ Azalt: Daha hassas (gürültü riski).
Salınım Seviyeleri
SalınımBoyutuL/R:-
- ⬆️ Artır: Önemli salınımları tanımlar.
- ⬇️ Azalt: Küçük dönüşleri yakalar.
Doldurulana Kadar Uzat:-
- ✅ Etkin: Seviyeler fiyat onlara ulaşana kadar kalır.
Order Block’lar
Azaltma Yöntemi:-
- ✨
Fitil: Daha hızlı sinyaller (fitile dokunur). - 🎯
Kapanış: Daha güçlü sinyaller (blok dışında kapanış).
- ✨
Likidite Bulucu
Statik/Dinamik Hassasiyet:-
- ⬆️ Artır: Daha az bölge (daha yüksek kalite).
- ⬇️ Azalt: Daha fazla bölge (daha yüksek hassasiyet).
Özet
Key components include:
- **Order Blocks:** Zones of significant institutional buying (bullish) or selling (bearish) identified by volume spikes near highs or lows, signaling potential price rebounds or reversals.
- **Swing Levels:** Critical highs and lows defining market structure, with breaks indicating bullish or bearish continuations.
- **Break of Structure (BoS):** Decisive breaks of swing highs or lows, linked to fractal patterns, signaling trend direction.
- **Change of Character (ChoCh):** Structural shifts indicating trend reversals, triggered by breaking swing lows in uptrends or swing highs in downtrends.
- **Liquidity Zones:** Static (horizontal levels with clustered highs/lows) and dynamic (trendlines connecting pivots) zones highlighting institutional stop hunts and congestion areas.
The indicator supports smart money concepts, reflecting institutional market behavior phases: Accumulation, Markup, Distribution, and Markdown. Parameter tuning options allow adjustment of sensitivity and signal strength for Market Structure, Swing Levels, Order Blocks, and Liquidity Finder components. This tool aims to enhance market analysis by revealing institutional activity and improving trade decision-making.
Müşteri değerlendirmeleri
5 | 33 % | |
4 | 67 % | |
3 | 0 % | |
2 | 0 % | |
1 | 0 % |


